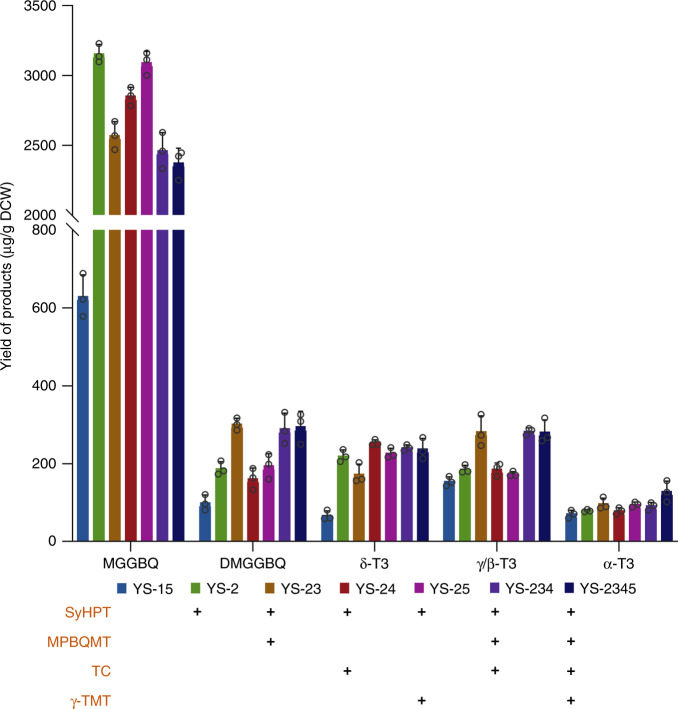
Fig. 2. Product profiles of the yeast strains overexpressing different enzyme combinations of the tocotrienols synthetic pathway.
Columns of different colors represent different strains, and the horizontal axis shows different metabolites in the tocotrienols synthetic pathway. The enzymes overexpressed with an extra gene copy in each strain are indicated with ‘+’. All values presented are the means of three biological replicates, and error bars represent standard deviations. Source data are provided as a Source Data file.

