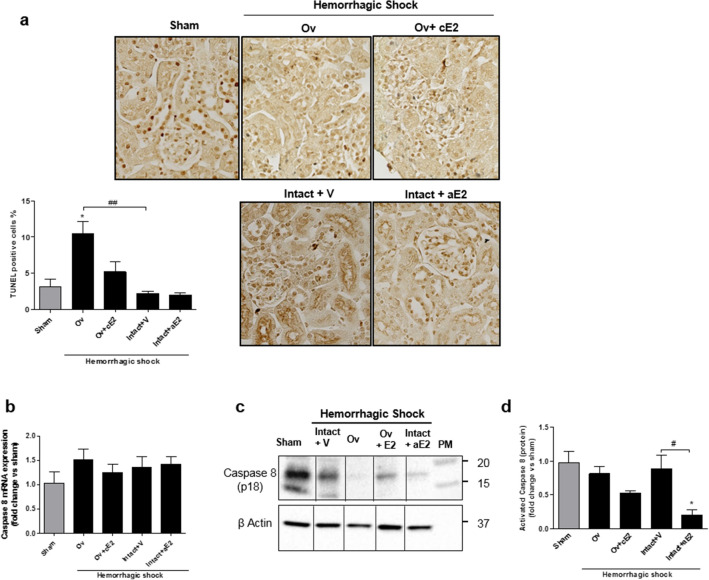
Figure 4.
Cell death at day 1. (a) picture of renal cortex stained by TUNEL method (magnification X800) and quantification of stained nuclei, n = 6 for all groups. Apoptosis at day 1 (b to d): (b) Caspase 8 mRNA expression (from whole kidney); (c) Western Blot of the cleaved-form of caspase 8; (d) quantification of the expression of cleaved-form of caspase 8 from 4 independent Western-Blot. Sham: non-shocked mice; Ov: ovariectomized mice; Ov + cE2: ovariectomized mice with chronic estradiol substitution; Intact + V: non ovariectomized mice receiving vehicle; Intact + aE2: intact mice receiving 25 µg of estradiol at the end of resuscitation. Relative mRNA expression levels were calculated using the ΔΔCtCt method, normalized to HPRT and β actin, and expressed as fold changes relative to the sham animals. Data are presented as mean ± s.e.m. *P < 0.05 versus sham; #P < 0.05 and ##P < 0.01 for indicated comparison.

