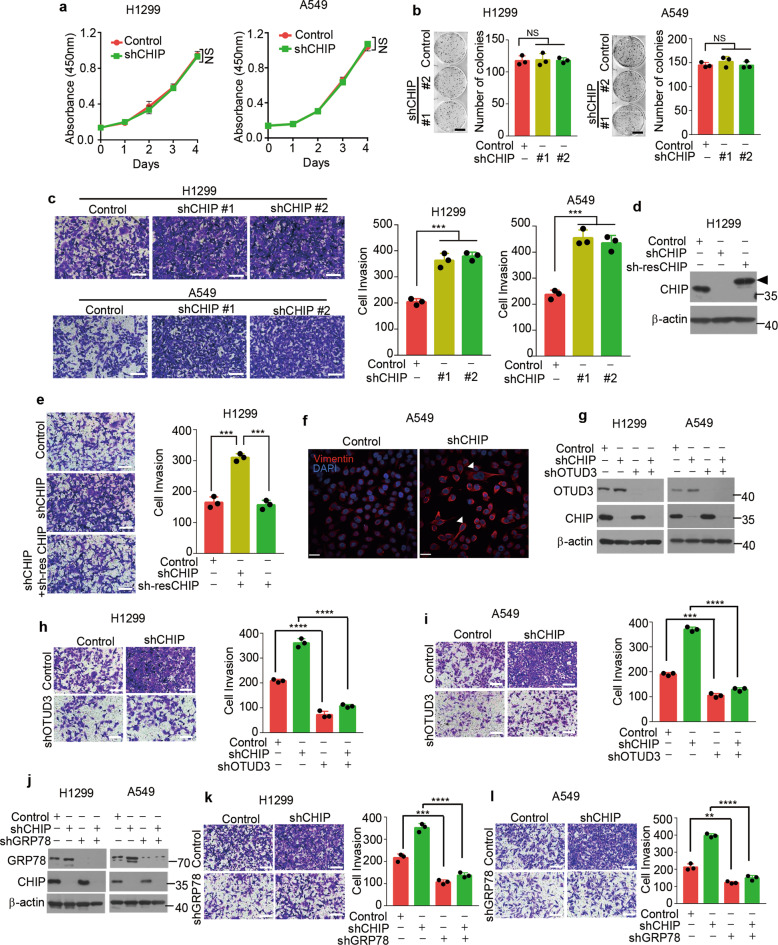
Fig. 5. CHIP suppresses invasion of lung cancer cells.
a Cell proliferation assays in H1299 or A549 cells stably expressing control shRNA or CHIP shRNA. Relative cell number was determined by adding WST-8 and then measuring absorbance at 450 nm. n = 3 independent experiments. b Representative images of colony formation assays in H1299 or A549 cells stably expressing control or CHIP shRNAs (shCHIP #1, shCHIP #2) 2 weeks after seeding of 500 cells in six-well plate. Quantification of colonies >0.1 mm in diameter is shown. n = 3 independent experiments. Scale bar: 1 cm. c Representative images of invasion assays in H1299 or A549 cells stably expressing control or CHIP shRNAs (shCHIP #1, shCHIP #2) 24 h after seeding of 3 × 10⁵ cells. Quantification of invaded cells stained by 0.1% crystal violet per field is shown. n = 3 independent experiments. Scale bar: 100 μm. d H1299 cells stably expressing CHIP shRNA (shCHIP #1) were infected with or without lentivirus expressing shRNA-resistant (sh-res) CHIP. The indicated proteins were detected by western blotting. Triangle: The shRNA-resistant (sh-res) CHIP was cloned into pCDH-MCS-T2A-copGFP-MSCV vector (System Biosciences, CD523A-1), which generated a high-molecular-weight CHIP as several amino acids were linked to CHIP C-terminal after T2A peptide self-cleavage. e Representative images of invasion assays in H1299 cells stably expressing control shRNA, CHIP shRNA together with or without shRNA-resistant CHIP 24 h after seeding of 3 × 10⁵ cells. Quantification of invaded cells stained by 0.1% crystal violet per field is shown. n = 3 independent experiments. Scale bar: 100 μm. f Representative images for Vimentin staining (Red) of A549 cells stably expressing control shRNA or CHIP shRNA. Nuclei were stained with DAPI (blue). White triangles indicate spindle-liked A549 cells. Scale bar: 40 μm. g H1299 or A549 cells stably expressing control shRNA or CHIP shRNA were infected with or without lentivirus expressing OTUD3 shRNA and selected, the indicated proteins were detected by western blotting. Representative images of invasion assays in H1299 (h) or A549 (i) cells stably expressing the shRNAs described in g 24 h after seeding of 3 × 10⁵ cells. Quantification of invaded cells stained by 0.1% crystal violet per field is shown. n = 3 independent experiments. Scale bar: 100 μm. j H1299 or A549 cells stably expressing control shRNA or CHIP shRNA were infected with or without lentivirus expressing GRP78 shRNA and selected, the indicated proteins were detected by western blotting. Representative images of invasion assays in H1299 (k) or A549 (l) cells stably expressing the shRNAs described in j 24 h after seeding of 3 × 10⁵ cells. Quantification of invaded cells stained by 0.1% crystal violet per field is shown. n = 3 independent experiments. Scale bar: 100 μm. Data are shown as mean ± s.d. Statistical analyses in a were performed using two-way ANOVA tests, and in b, c, e, h, i, k, l were performed with Student’s t tests. **p < 0.01, ***p < 0.001, ****p < 0.0001; NS not significant.

