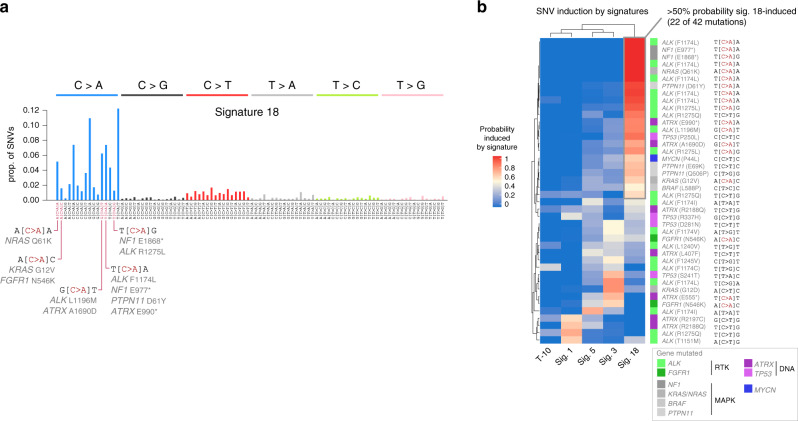
Fig. 5. Driver SNVs caused by signature 18.
a Spectrum of signature 18, with 6 SNV types indicated at top and the trinucleotide context indicated at bottom. C>A mutations commonly affecting driver genes are indicated at bottom. b Heatmap showing probability that each somatic driver SNV (rows) was caused by each signature (columns). Each row represents one mutation in a specific patient. Trinucleotide context of each mutation is indicated at right. Genes are color-coded as indicated in legend at bottom-right. Only driver SNVs in diagnosis WGS samples with highly reliable signature data (cosine reconstruction similarity of 0.9 or higher; n = 38 samples and 42 mutations) were analyzed. Source data are provided as a Source Data file.

