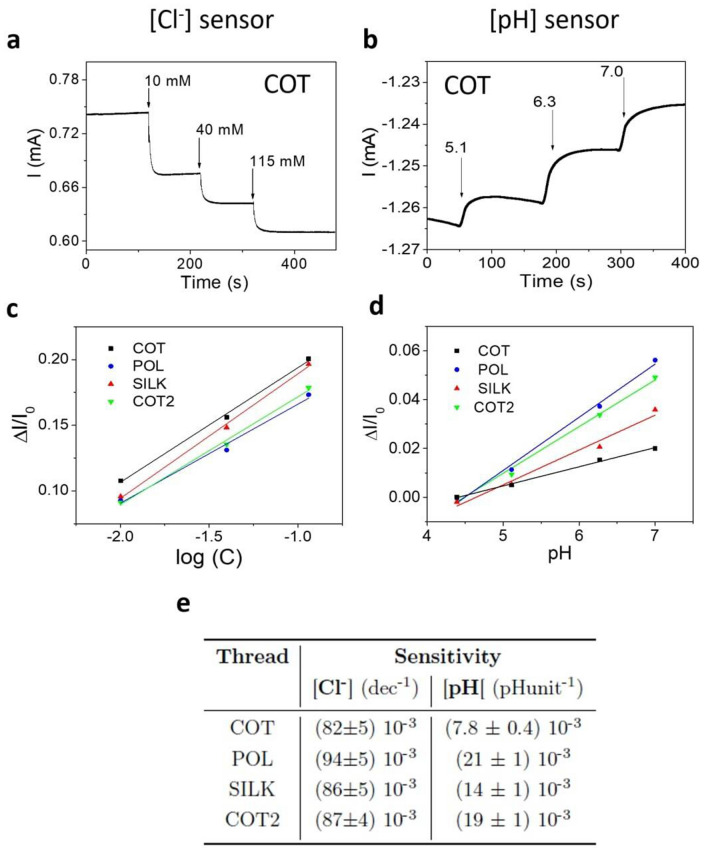
Figure 3.
Current vs time plots recorded in 10 mL of Universal buffer: (a) COT Cl− sensor response in the chloride relevant concentration range of human sweat between 10 and 100 mM. The Cl− concentration has been increased adding 2 M of KCl in the whole solution. The applied potential is 0.1 V. (b) COT pH sensor response in the pH relevant range for human sweat between 5 and 7 pH level. The pH has been increased adding 1 M of KOH. The applied potential is − 0.2 V. Linear response of the normalized current variation versus the (c) logarithm of chloride ion concentration and (d) pH value, for the four yarns. Each thread was characterized separately. The error bars are omitted as the relative error is less than 1%. (e) Summary of threads sensitivities for all the different analysed fibers.

