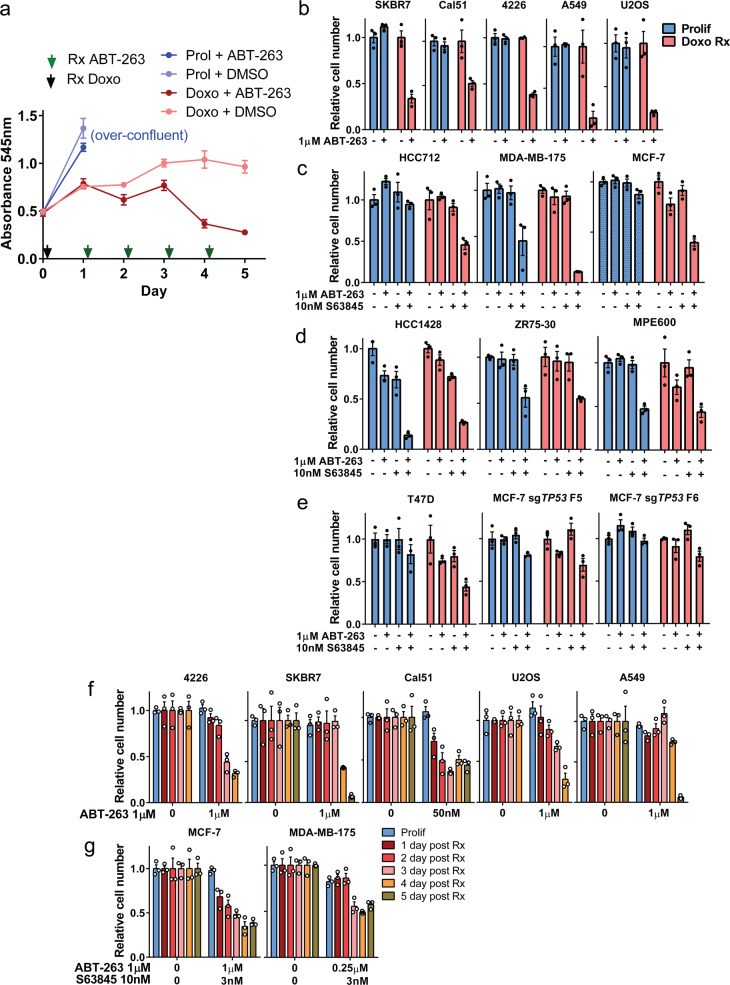
Fig. 1. ABT-263 treatment alone or in combination with S63845 can selectively eliminate chemotherapy-induced senescent cells.
a 4226 mammary tumor cell line was plated in 24 well plates in parallel, and 1 day later treated with 0.75 μM doxorubicin (Doxo, indicated by black arrow) or left untreated to continue proliferating (Prolif). For the following 4 days, one plate was treated with a single dose of 1 μM ABT-263 (as indicated by green arrows), and then cell number determined by MTT assay 24 h later. Absorbance was plotted for triplicate wells of each treatment group over time. Untreated cells grew to conflunce 2 days after plating and then lifted off the plate (noted as “over-confluent”). Error bars represent SEM. Indicated p53 wild type (b–d) or p53 mutant/edited (e) cancer cell lines were plated and the next day treated with doxorubicin (0.25–1 μM) for 24 h (Doxo Rx cells). Seven days after treatment, in parallel with untreated, proliferating cells (Prolif), ABT-263 (1 μM), S63845 (10 nM), or both were added as indicated and then MTT assay was performed 24 h later to determine cell number. f–g Indicated cell lines were plated and doxorubicin treated as in (b–e) and cell number determined by MTT assay after ABT-263 or ABT-263 + S63845 treatment each day following doxorubicin treatment. Bar graphs for (b–g) show mean ± SEM with individual data points plotted. Nonnormalized data for (b–g) are shown in Supplementary Fig. 2b–g. Statistics (complete analysis available in Supplementary Table 1) used were (b) Student’s t test comparing two groups: control vs. ABT-263 treated, for Prolif and Doxo Rx separately. (c–e) ANOVA with Tukey’s posttest comparing four groups: control, ABT-263, S63845, ABT-263 + S63845, for Prolif and Doxo Rx separately. f–g Student’s t test comparing two groups: control vs. ABT-263 or ABT-263/S63845 treated, for each day post Doxo Rx separately. In (b–g), the DMSO group (indicated by “−” or “0” signifying no ABT-263) was normalized to 1.0 for Prolif and 1.0 for each treatment group. Each treatment group was in triplicate and individual data points are shown. Error bars indicate SEM.

