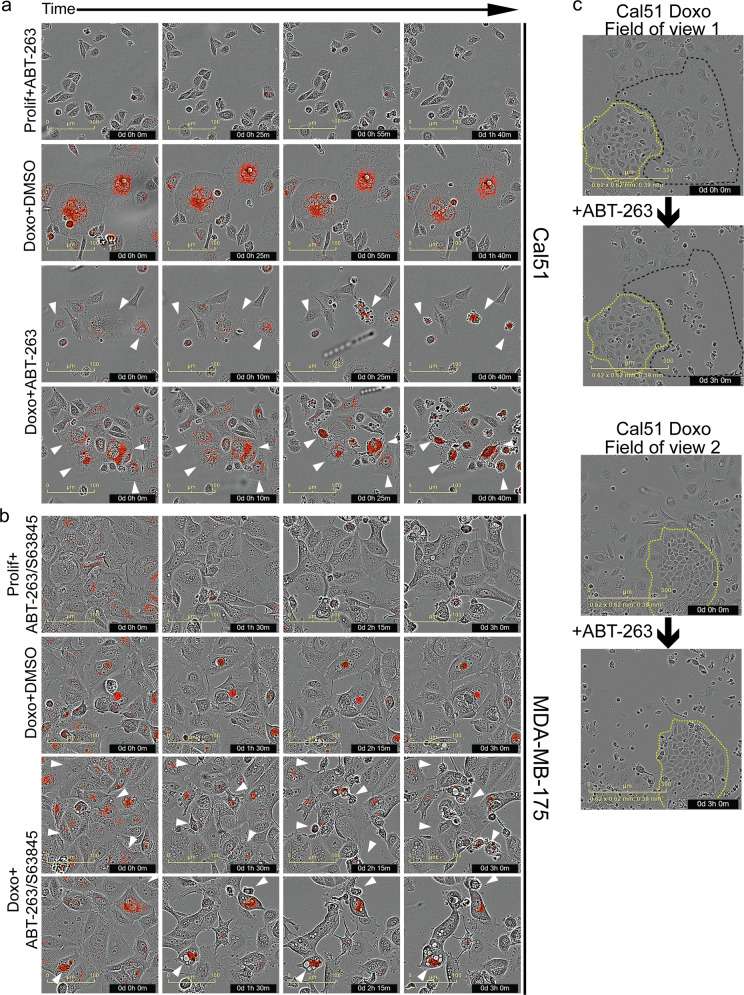
Fig. 4. Doxorubicin-treated cells with senescent phenotypes are sensitive to senolytic drugs.
Cal51 (a) or MDA-MB-175 (b) cells were plated and the next day treated with doxorubicin (0.25 μM) for 24 h (Doxo Rx cells) or left untreated and proliferating (Prolif). Seven days after treatment, cells were stained with LysoTracker (75 nM), treated with DMSO or indicated senolytic drug(s), and then placed on an IncuCyte and imaged over 4 h. Shown are representative time-lapse images for the different treatment groups. Arrowheads indicate LysoTracker positive cells that undergo cell death in the time lapse. Scale bar represents 100 μM. c Cal51 cells were plated and the next day treated with doxorubicin (0.25 μM) for 24 h. Cells were then placed on IncuCyte for live-cell imaging. Six days later, cells were treated with ABT-263 (1 μM), cell death of proliferating and senescent cells was determined visually via live-cell imaging and two representive fields of view are shown, pre and 3 h post addition of ABT-263. Scale bar represents 300 μM.

