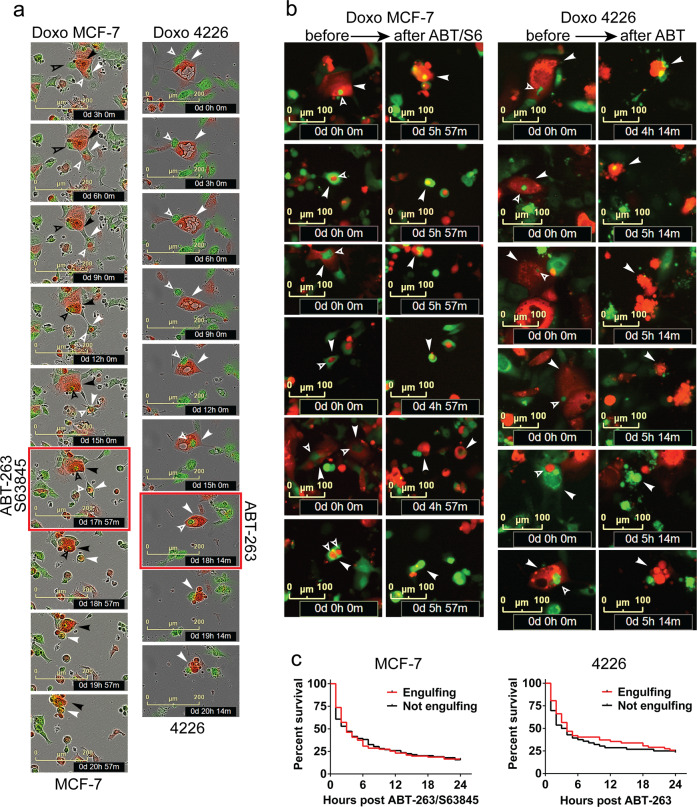
Fig. 5. Cell cannibalism phenotype does not protect doxorubicin treated, senescent cells from senolytic drugs.
a GFP and mCherry expressing MCF-7 or 4226 cells were plated together, and the next day treated with doxorubicin (0.25 μM for MCF-7; 0.75 μM for 4226) for 24 h (Doxo). On day 3, cells were placed on an IncuCyte and imaged every 3 h. On day 7, frequent cell engulfment was observed, and cells were treated with indicated senolytic at the image time point with the red outline. Cells were continually imaged every hour. Time-lapse images show representative predator cells (solid arrowheads) engulfing prey cells (open arrowheads), and subsequent cell death induced by senolytic treatment. b Representative images of doxorubicin-treated senescent, engulfing MCF-7 or 4226 cells captured before (left) and after (right) senolytic treatment. Solid arrowheads indicate engulfing predator cells, and open arrowheads indicate engulfed prey cells. Time stamps are noted in the image. Scale represents 100 μM. c Single cells from the MCF-7 and 4226 imaged in (b) were followed in time to determine if they had engulfed or not, and then were scored for the time point when they adopted characteristic features of apoptosis and cell death following senolytic treatment. Survival data from two independent experiments were plotted on a Kaplan–Meier curve with >30 cells in each group in each experiment for both cell lines. Differences in survival for both cell lines were not significant by Log-rank (Mantel–Cox) test.

