Figure 1.
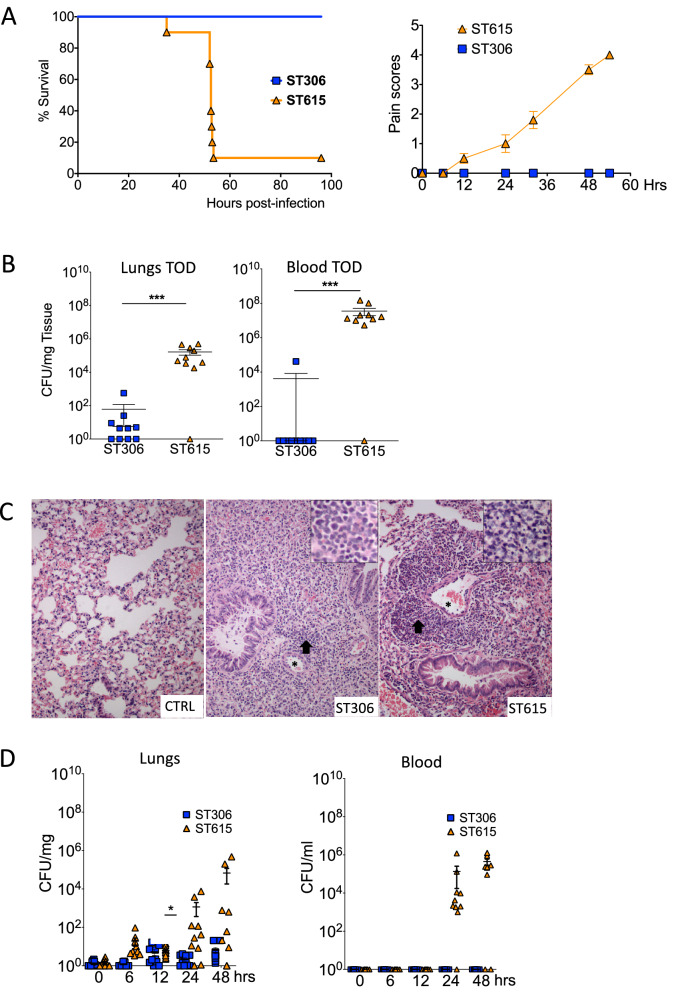
ST615 is more virulent than ST306 pneumococcal clone. (A) Comparative study using a mouse model of invasive pneumonia. Kaplan–Meier survival chart monitoring the number of mice succumbing to disease over 96 h. At the experimental endpoint, all mice (100%) challenged with ST306 survived as opposed to 10% survival only in mice challenged with ST615 (n = 10 mice per group, Log-rank test, ***p < 0.0001). Upon challenge with pneumococci, mice were monitored for the development of visual signs of disease (n = 10 mice per group; mean ± SEM). Pain scores were assigned as follows 1: hunched, 2: starry/piloerecti, 3: lethargic, 4: moribund, 5: dead. (B) Pneumococcal viable counts (CFU/ml) in lung tissues and peripheral blood upon intranasal infection of mice with ST306 compared with ST615 pneumococci at time of death (TOD). Data are represented as mean ± SEM (n = 10 mice per group). Each mouse is represented by a symbol. Statistical significance (Student t-test, ***p < 0.001). (C) Histological analysis of lung tissues collected from ST306 versus ST615-challenged mice using an invasive pneumonia infection model compared with naïve control (CTRL). Asterisks indicate vessels while arrows represent inflammatory cell infiltration. Inset: magnification of inflammation area. Original magnification × 20 (inset 40 ×); scale bar 50 microns (inset: 20 microns). (D) Kinetics of infection as monitored by pneumococcal viable counts. Mice were challenged intranasally with 10 μl of sterile PBS containing 1 × 10⁶ CFU/mouse of ST306 or ST615 pneumococci. Mice were culled at the indicated time points and viable counts were determined by the Miles and Misra technique in homogenised lung tissue and blood. Data are represented as mean ± SEM, n = 10 mice per group per time point.

