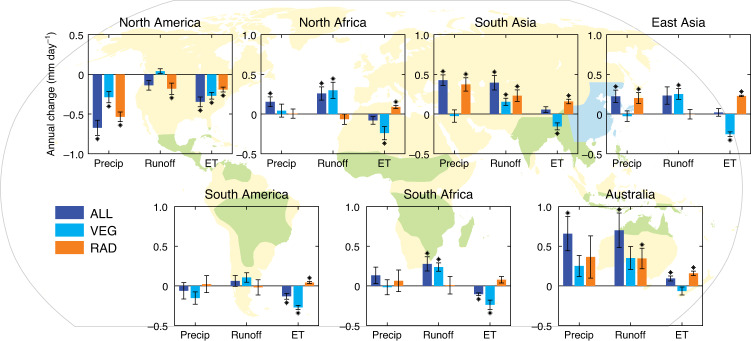
Fig. 1. Annual-mean changes in precipitation (precip), runoff and evapotranspiration (ET) in different simulations.
The dark blue, light blue and orange bars indicate the predictions from all CO2-based forcings (ALL), physiological only (VEG) and radiative only (RAD), respectively, on hydrological impacts and in each monsoon region as labelled. The bars are model mean, and the error bars (thin lines) indicate standard errors of the mean of the four ESMs analysed. Changes are quantified by the differences of the model years 121–140 (~4 × CO2-enriched), and the years 1–20 (historical; see Methods section). Asterisks indicate that the change is significant for the four ESMs (P < 0.05, t-test), and so the latter test is based on the standard errors to assess if there is a mean change. Regional monsoon domains are shown in light green colours on the background map, while East Asia is in light blue in order to distinguish it from South Asia.

