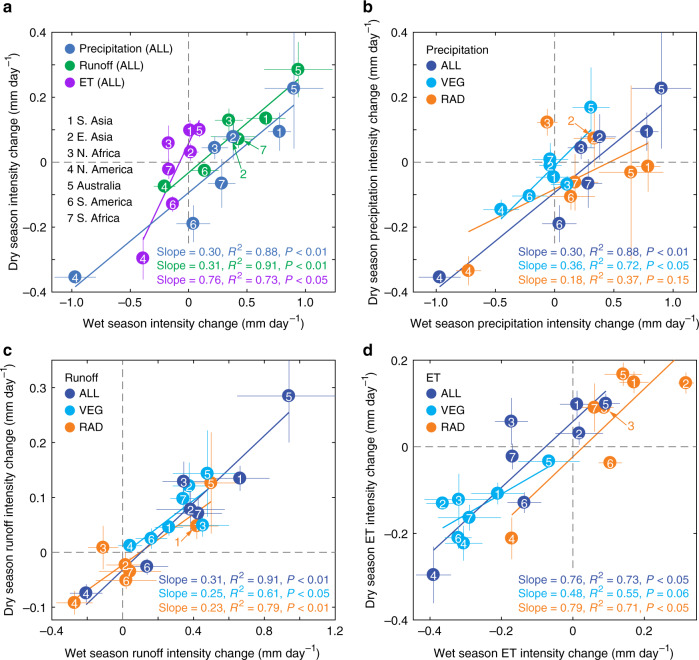
Fig. 2. Intensity changes in precipitation, runoff and evapotranspiration (ET) and their drivers in wet and dry seasons.
a Intensity change in precipitation, runoff and ET in wet (horizontal axis) and dry seasons (vertical axis) in all CO2-based forcings (ALL) simulations. Regions labelled as 1–7. Any overlapping circles are pointed to by labels connected by an arrow. The colour lines indicate the linear regressions between water cycle component changes in wet and dry seasons across the seven monsoon regions, with the slope value and statistical information shown in the bottom right. b–d Intensity changes in ALL simulations are further divided into physiological (RAD) and radiative (VEG) drivers in wet and dry seasons for b Precipitation, c Runoff, and d ET. Intensity changes are quantified by the differences of the years 121–140 (approximately atmospheric enrichment of 4 × CO2 of preindustrial levels) of simulations and the years 1–20 (historical) in the wet or dry seasons. The wet season is defined as the months where ET < precipitation, and vice versa for the dry season. Wet and dry season lengths are kept constant and correspond to those for the historical period and for each monsoon region. This approach allows changes in average seasonal intensity to be isolated from changes in season length (see Methods section). The thin lines are error bars, indicating the standard errors of the mean of the four ESMs.

