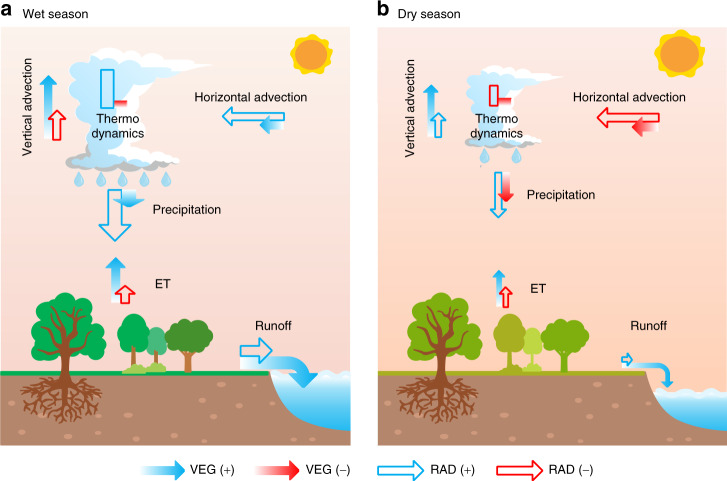
Fig. 4. Schematic diagram of the mechanisms driving seasonal monsoon precipitation and runoff changes in the five monsoon regions with annual precipitation increase.
Changes in precipitation, runoff and evapotranspiration (ET) in a wet and b dry seasons. Precipitation change is divided into thermodynamic effect, vertical advection, horizontal advection and land ET components as marked (see also Methods section). The solid and open arrows (or rectangles) represent the vegetation-physiological (VEG) and radiative forcings (RAD) of rising CO2 in each process, respectively. The blue or red colour indicates if the change is beneficial (+) or adverse (−) to runoff change, respectively, rather than the sign of the change itself. The size of the arrows (or rectangles) denotes the relative magnitude of each change averaged over the five monsoon regions (hence excluding North and South America). The signs of precipitation and its component changes are generally consistent among the five monsoon regions, although there are a small number of exceptions (Supplementary Table 3). In the wet season a, RAD-induced warming dominates the increases in atmospheric precipitable water, advection and precipitation, although VEG forcing via rising CO2 also increases precipitation by enhancing atmospheric circulation (vertical advection and horizontal advection). VEG-induced land ET reduction and precipitation increase result in more water flowing as runoff. In the dry season b, RAD-induced increases in vertical advection and land ET overcome the negative impacts of horizontal advection and thermodynamic decreases, facilitating precipitation increase, although VEG exerts an adverse impact on precipitation. However, VEG-induced ET decrease still drives an increase in runoff.

