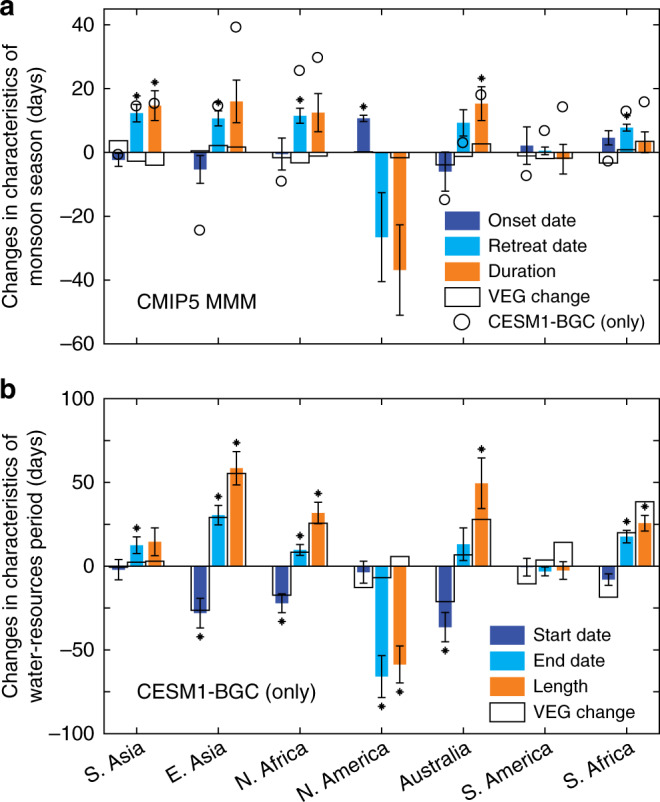
Fig. 5. Changes in seasonal characteristics of monsoon season and abundant water-resources period.

a Monsoon season changes from the CMIP5 multi-model mean (MMM) for the seven regions as marked. Indices of seasonal characteristics are monsoon onset date, retreat date and monsoon season duration, presented for the all CO2-based forcings (ALL) simulations (colour bars). The error bars indicate standard errors of the mean of the three ESMs. Small black asterisks indicate if changes are significant for the three ESMs (P < 0.05, t-test). The NorESM1-ME model is not included due to a lack of daily precipitation output in the CMIP5 archives. Black open rectangles indicate the changes associated with the physiological (VEG)-only forcing. Changes in monsoon season duration in ALL simulations from the CESM1-BGC only model are also presented (open circles). The changes in North America from CESM1-BGC are not available due to model dry bias (Supplementary Fig. 2d) and significant precipitation reductions at 4 × CO2 (Supplementary Fig. 11d). b Abundant water resources period. Seasonal characteristic indices are start date, end date and length of abundant water resources period. Values in b are for only one model, CESM1-BGC, as no daily runoff output is available in the CMIP5 archives for the four ESMs (see Methods section). The error bars indicate standard errors based on interannual variability of runoff from CESM1-BGC only. Small black asterisks indicate that the change is significant in the CO2-enriched climate relative to the preindustrial period (P < 0.05, t-test).
