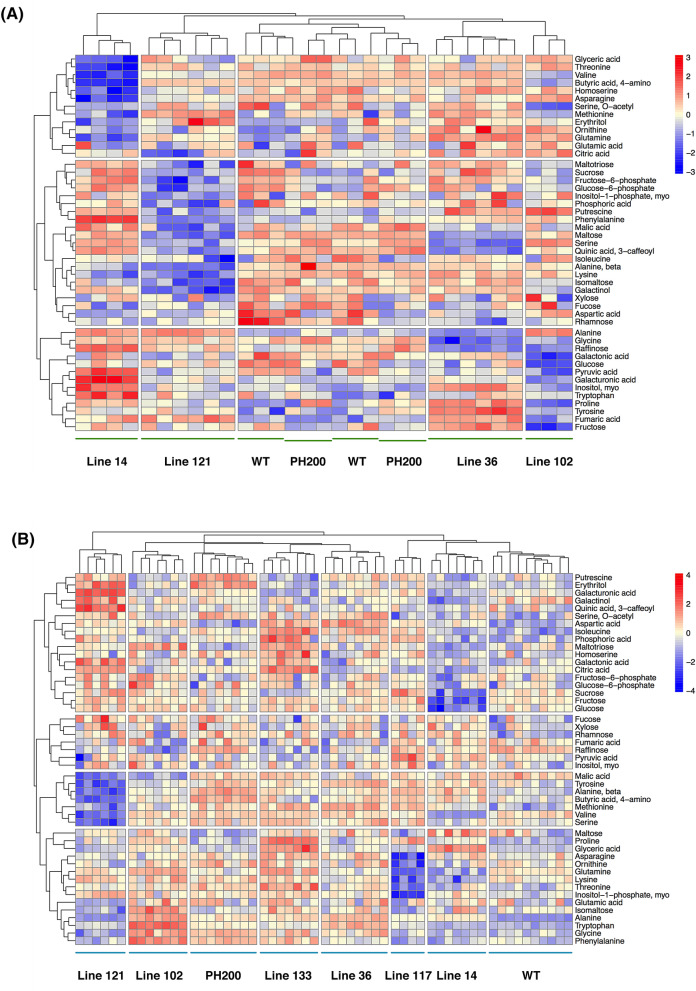
Figure 3.
Hierarchical clustering of the primary metabolite data from selected transgenic lines under glasshouse (A) and polytunnel (B) conditions. Relative metabolite levels were normalized (Z-Score) of each sample for each grown condition and to dry weight. Each biological replicate is shown independently. For negative controls, WT and PH200 were used (PH200 was originated from an independent transformation, containing only the nptII gene under 35S promoter). Full documentation of metabolite profiling data acquisition is provided in Supplementary Table S3 and S4. Data analysis and graphical representation were performed using R Software (https://www.R-project.org/).

