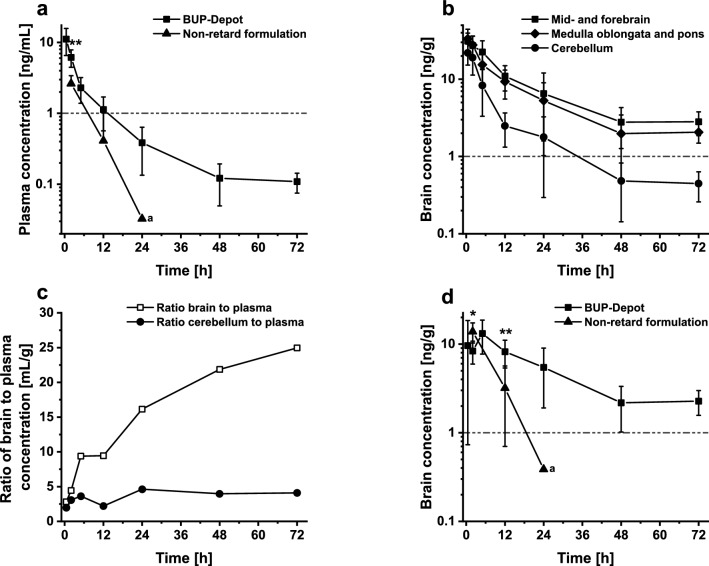
Figure 3.
Plasma and regional brain concentration–time profiles. (a) Plasma concentration–time profile of RG 502 H-Big (BUP-Depot) and non-retard formulation. Unpaired t-test showed significant difference between formulations for 2 h (P = 0.0009) but not for 12 h (P = 0.051). (b) Regional brain concentrations of BUP-Depot in mid-and forebrain, medulla oblongata and pons, and cerebellum. (c) Brain-to-plasma ratio-time profiles of BUP-Depot. Brain concentrations are defined as sum of concentrations of mid- and forebrain, medulla oblongata and pons. (d) Specific binding of BUP-Depot and non-retard formulation in brain. Specific binding is defined as difference between combined concentrations of mid- and forebrain, medulla oblongata and pons and concentrations in cerebellum. Unpaired t-test showed significant difference at 2 h (P = 0.01) and 12 h post injection (P = 0.006) between both formulations. BUP-Depot (1.2 mg/kg) and non-retard formulation (0.1 mg/kg) were injected once subcutaneously. Dashed line in all graphs represents threshold of 1 ng/mL or 1 ng/g. Data expressed as mean ± SD. a: 24 h time point of non-retard formulation could not be statistically analyzed as only 2 out of 7 animals showed values higher than LLOQ for concentrations in plasma and cerebellum. Values below LLOQ were excluded, therefore no SD value is shown. (P < 0.05 *; P < 0.01 **).

