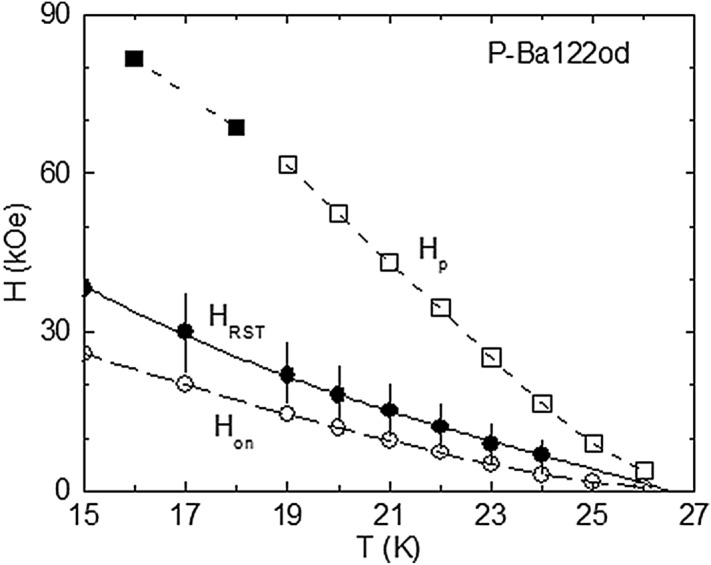
Figure 4.

Temperature variation of the structural transition field HST (determined as in Fig. 2), the onset field Hon(T), and the peak field Hp(T). The vertical segments on HST(T) illustrate the transition width extracted for several temperatures (by taking the structural transition symmetric relative to HST). The continuous line represents the fit of the HST(T) dependence with (2), by considering the two-fluid model for the temperature variation of the magnetic penetration depth. The filed-symbol Hp(T) values have been determined from the magnetic hysteresis curves registered with the PPMS.
