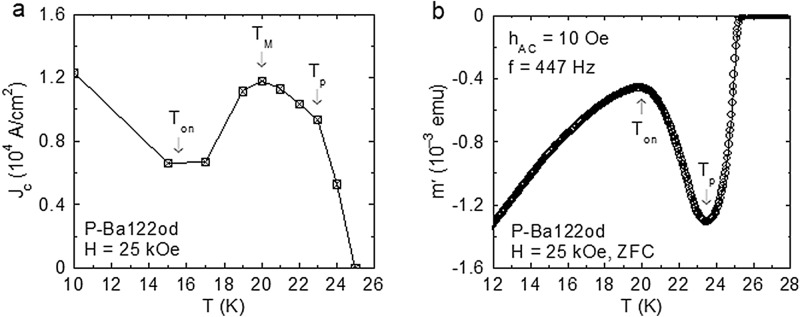
Figure 5.
(a) Temperature variation of the DC critical current density Jc(T) determined with the Bean model using the magnetic moment m(T) of P-Ba122od in H = 25 kOe, with m taken from the isothermal magnetic hysteresis curves m(H) registered at different T values (Fig. 3). The DC onset temperature Ton (around 16 K) and the DC peak temperature Tp = 23 K represent, in agreement with the m(H) curves from Fig. 3, the T values where the applied field H = 25 kOe equals Hon(T) and Hp(T), respectively. The Jc(T) maximum at TM = 20 K (between Ton and Tp) is directly related to the ∣m(T)∣ values where the m(H) shoulder is completed, and, due to the large transition width, TM is significantly higher that the structural transition temperature TRST(H = 25 kOe) ~ 18 K in Fig. 4. (b) Temperature dependence of the in-phase component m′ of the AC magnetic moment (directly related to the density of the macroscopic screening currents) for P-Ba122od in H = 25 kOe (ZFC, hAC = 10 Oe, f = 447 Hz). The onset temperature Ton and the peak temperature Tp (indicated by arrows) correspond to the SMP generated in the sample region penetrated by the AC critical state (see text). Note that in b there is no feature to correspond to the Jc(T) maximum at TM in a.

