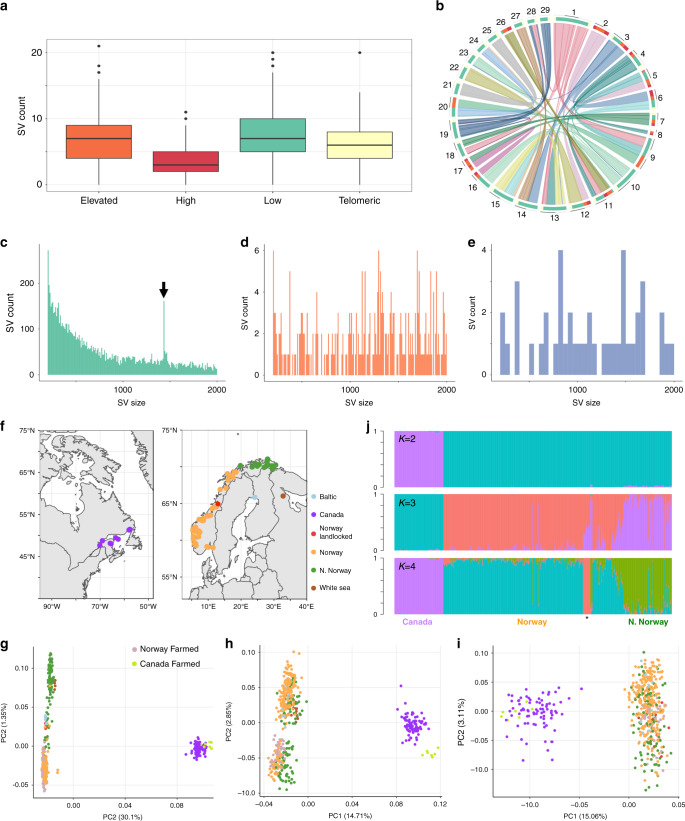
Fig. 1. SV landscape in 492 Atlantic salmon genomes.
a SV counts per one million bp window in the genome split into homology categories17 representing duplicated regions retained from the Ss4R WGD sharing ‘low’ (<90% identity), ‘elevated’ (90–95% identity) and ‘high’ (>95% identity) similarity in addition to telomere regions. Definition of box and whisker plots: the box spans the interquartile range, with the median (Q2) as a central bar, and respective upper and lower bounds representing the minimum and maximum values within the 25th percentile (Q1) and 75th percentile (Q3). The bounds of the upper and lower whisker are the largest and smallest values that lie within 1.5 times above Q3 and below Q1, respectively. Outliers out with these bounds are shown as individual points. b Locations of the same regions depicted on a Circos plot using the same colour scheme. c–e Size distributions of SVs for deletions (c), duplications (d) and inversions (e) with X-axis limited to SVs ≤2000 bp. Arrow in part c marks outlier peak in deletion calls (see Fig. 2). f Sampling locations of wild populations. g–i PCA for each SV class: 14,017 deletions (g), 1244 duplications (h), 242 inversions (i) with population matched by colour to part f for wild fish, and additional symbols given for farmed fish (note: all seven individuals annotated ‘Canada Farmed' were sampled in Chile, along with 13 individuals annotated as ‘Norwegian Farmed', consistent with their respective descent from the two major Atlantic salmon lineages in North America and Europe). j NGSadmix86 analysis of 14,017 deletions with K = 2, 3 and 4. Each individual is a vertical line with colours marking genetically distinct groups. Asterisk corresponds to White sea, Baltic and landlocked populations (K = 4 plot).

