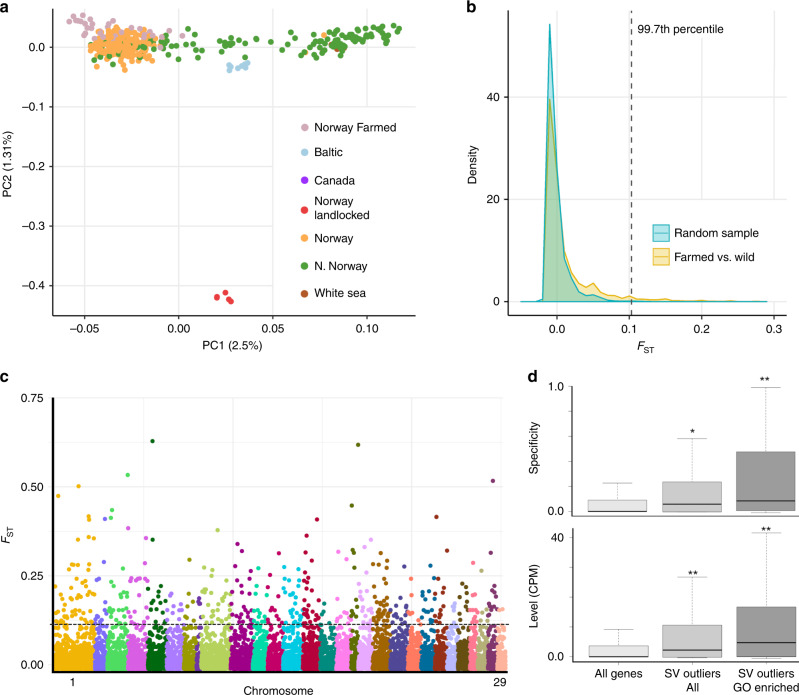
Fig. 3. Genetic differentiation of SVs between farmed and wild Atlantic salmon.
a PCA used to select appropriate wild individuals for FST comparison (n = 257) vs. farmed salmon (n = 34) on the basis of genetic distance by latitude (see also Supplementary Fig. 15) separated along PC1. The population symbols are the same as shown in Fig. 1. b Observed FST value distribution comparing farmed vs. wild salmon contrasted against 200 random distributions for the same number of individuals. Dotted line shows cut-off FST value employed in addition to a per SV criteria of P < 0.01. c Manhattan plot of 12,627 FST values with dotted line showing the same cut-off above which are the 584 SV outliers. d Brain gene expression specificity (top panel) and expression level (bottom panel) are increased compared to global expectations for genes linked to the 584 outlier SVs, with the effect pronounced for a 326 gene subset contributing to significantly enriched GO terms. Hypergeometric tests were performed to compare the proportion of genes showing brain expression specificity ≥0.50 between 44,469 genes detected in a multi-tissue transcriptome vs. (i) the 584 gene subset (all SV outliers) (single asterisk indicates P = 0.0041) and (ii) the 326 gene subset (SV outliers GO enriched) (double asterisk indicates P = 2.42e−07). Two-sample t-tests were used to compare the brain expression level (CPM) among the same 44,469 global gene set vs. (i) the 584 gene subset (all SV outliers) (double asterisk indicates P = 4.84e−07) and (ii) the 326 gene subset (SV outliers GO enriched) (double asterisk indicates P = 6.65e−07). The observed increase in expression was specific to brain (plots for other tissues shown in Supplementary Figs. 22 and 23). Results of statistical analysis for all tissues are shown in Supplementary Data 15. A definition of the box and whisker plots can be found in the Fig. 1a legend.

