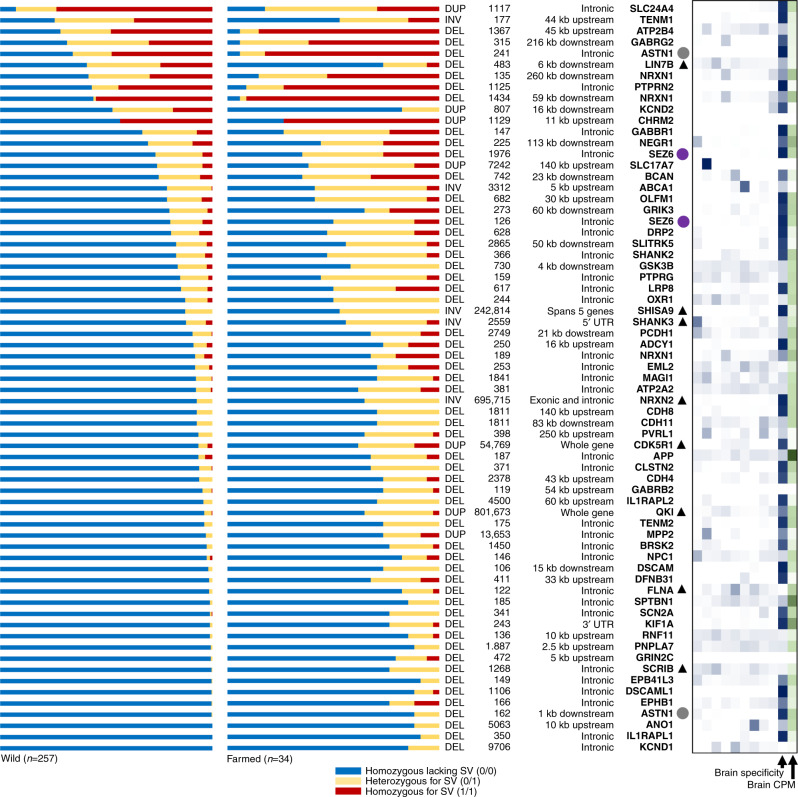
Fig. 4. SVs under selection during Atlantic salmon domestication are linked to 65 unique genes encoding synaptic proteins.
SV genotypes are visualized on the left, ordered from bottom to top with decreasing frequency of homozygous genotypes (0/0) lacking the SV in wild fish. Annotation of each SV type, its size and genomic location with respect to each synaptic gene is also shown. The circles next to genes highlight Ss4R ohnolog pairs and the black triangles indicate the overlap of an SV with a putative cis-regulatory element (ATAC-Seq peak). The heatmap on the right depicts the expression specificity of each gene across an RNA-Seq tissue panel17 (white to dark blue depicts lowest to highest tissue specificity; tissues shown in different columns from left to right: liver, gill, skeletal muscle, spleen, heart, foregut, pyloric caeca, pancreas and brain). The overall expression of each gene in brain is shown on the right of the heatmap (white to dark green depicts increasing CPM across the column). Data provided in Supplementary Data 16.

