
Figure 1.
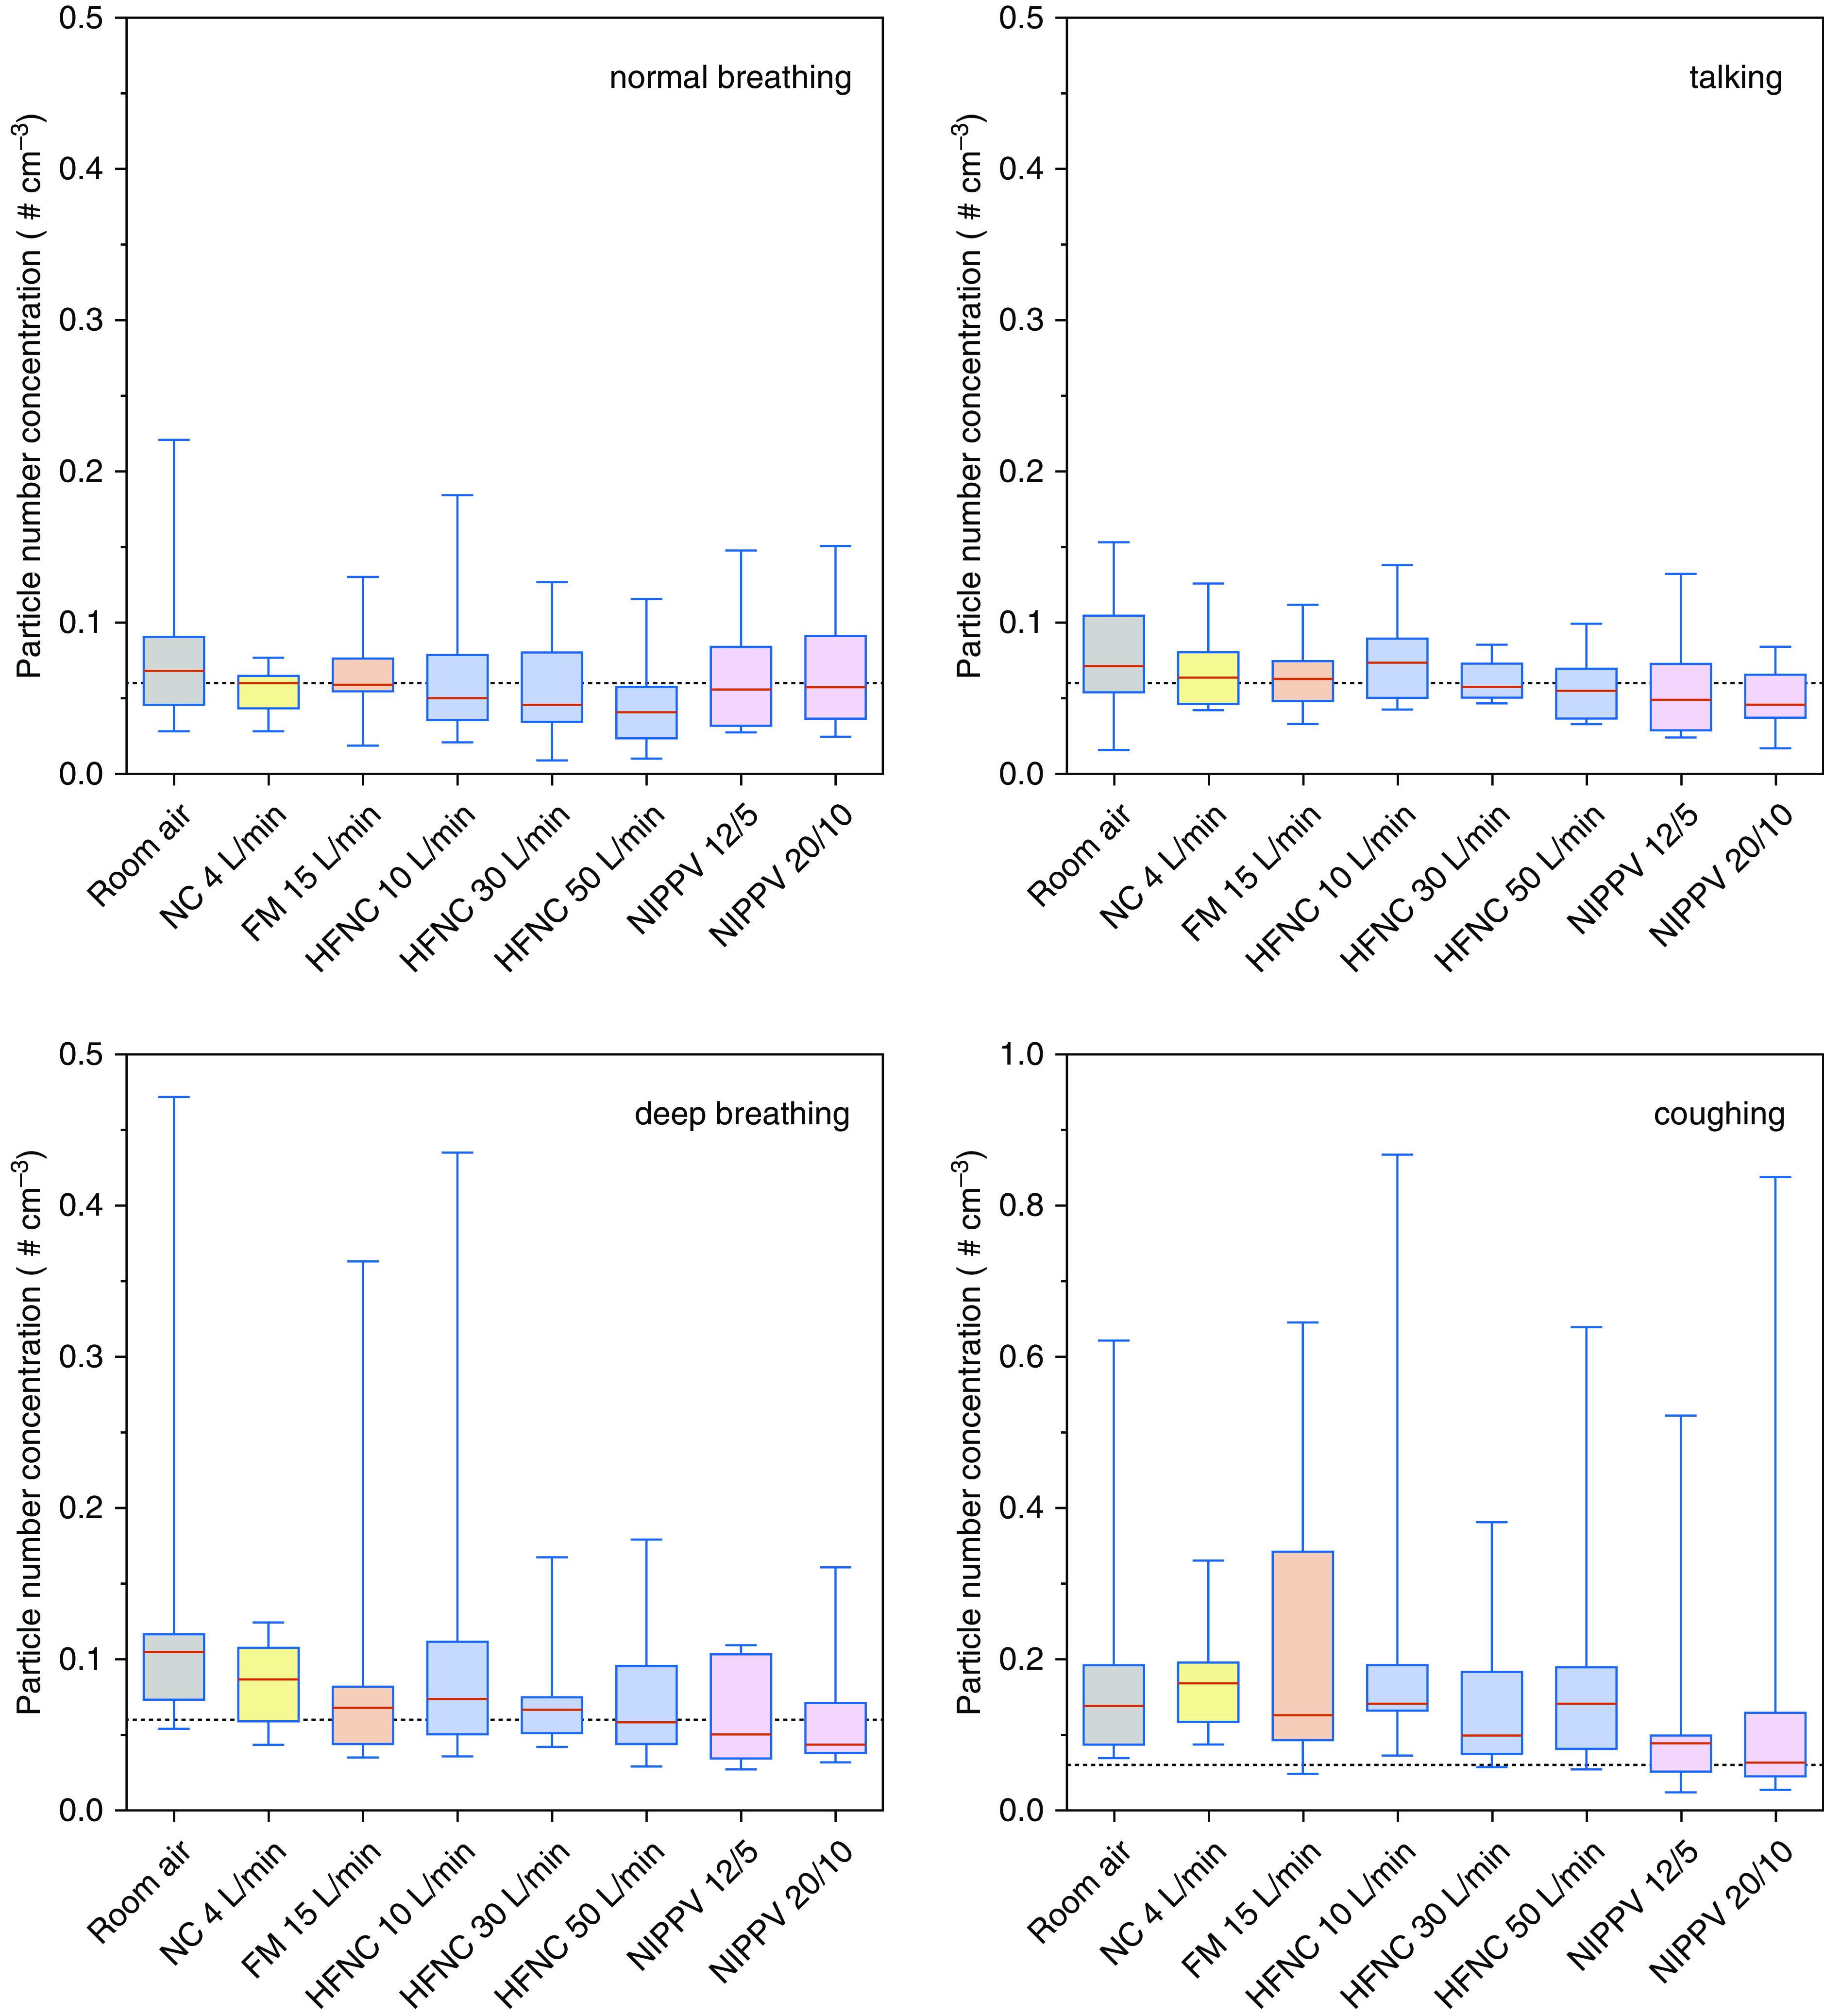
Particle number concentration with various modes of oxygen delivery. Box-and-whisker plots demonstrate the median and interquartile ranges. Note the change in scale of the y-axis in coughing. The horizontal dashed line represents the average baseline particle number concentration of the room (0.060 particles/cm3). FM = face mask; HFNC = heated and humidified high-flow nasal cannula; NC = nasal cannula; NIPPV = noninvasive positive-pressure ventilation.