
Figure 2.
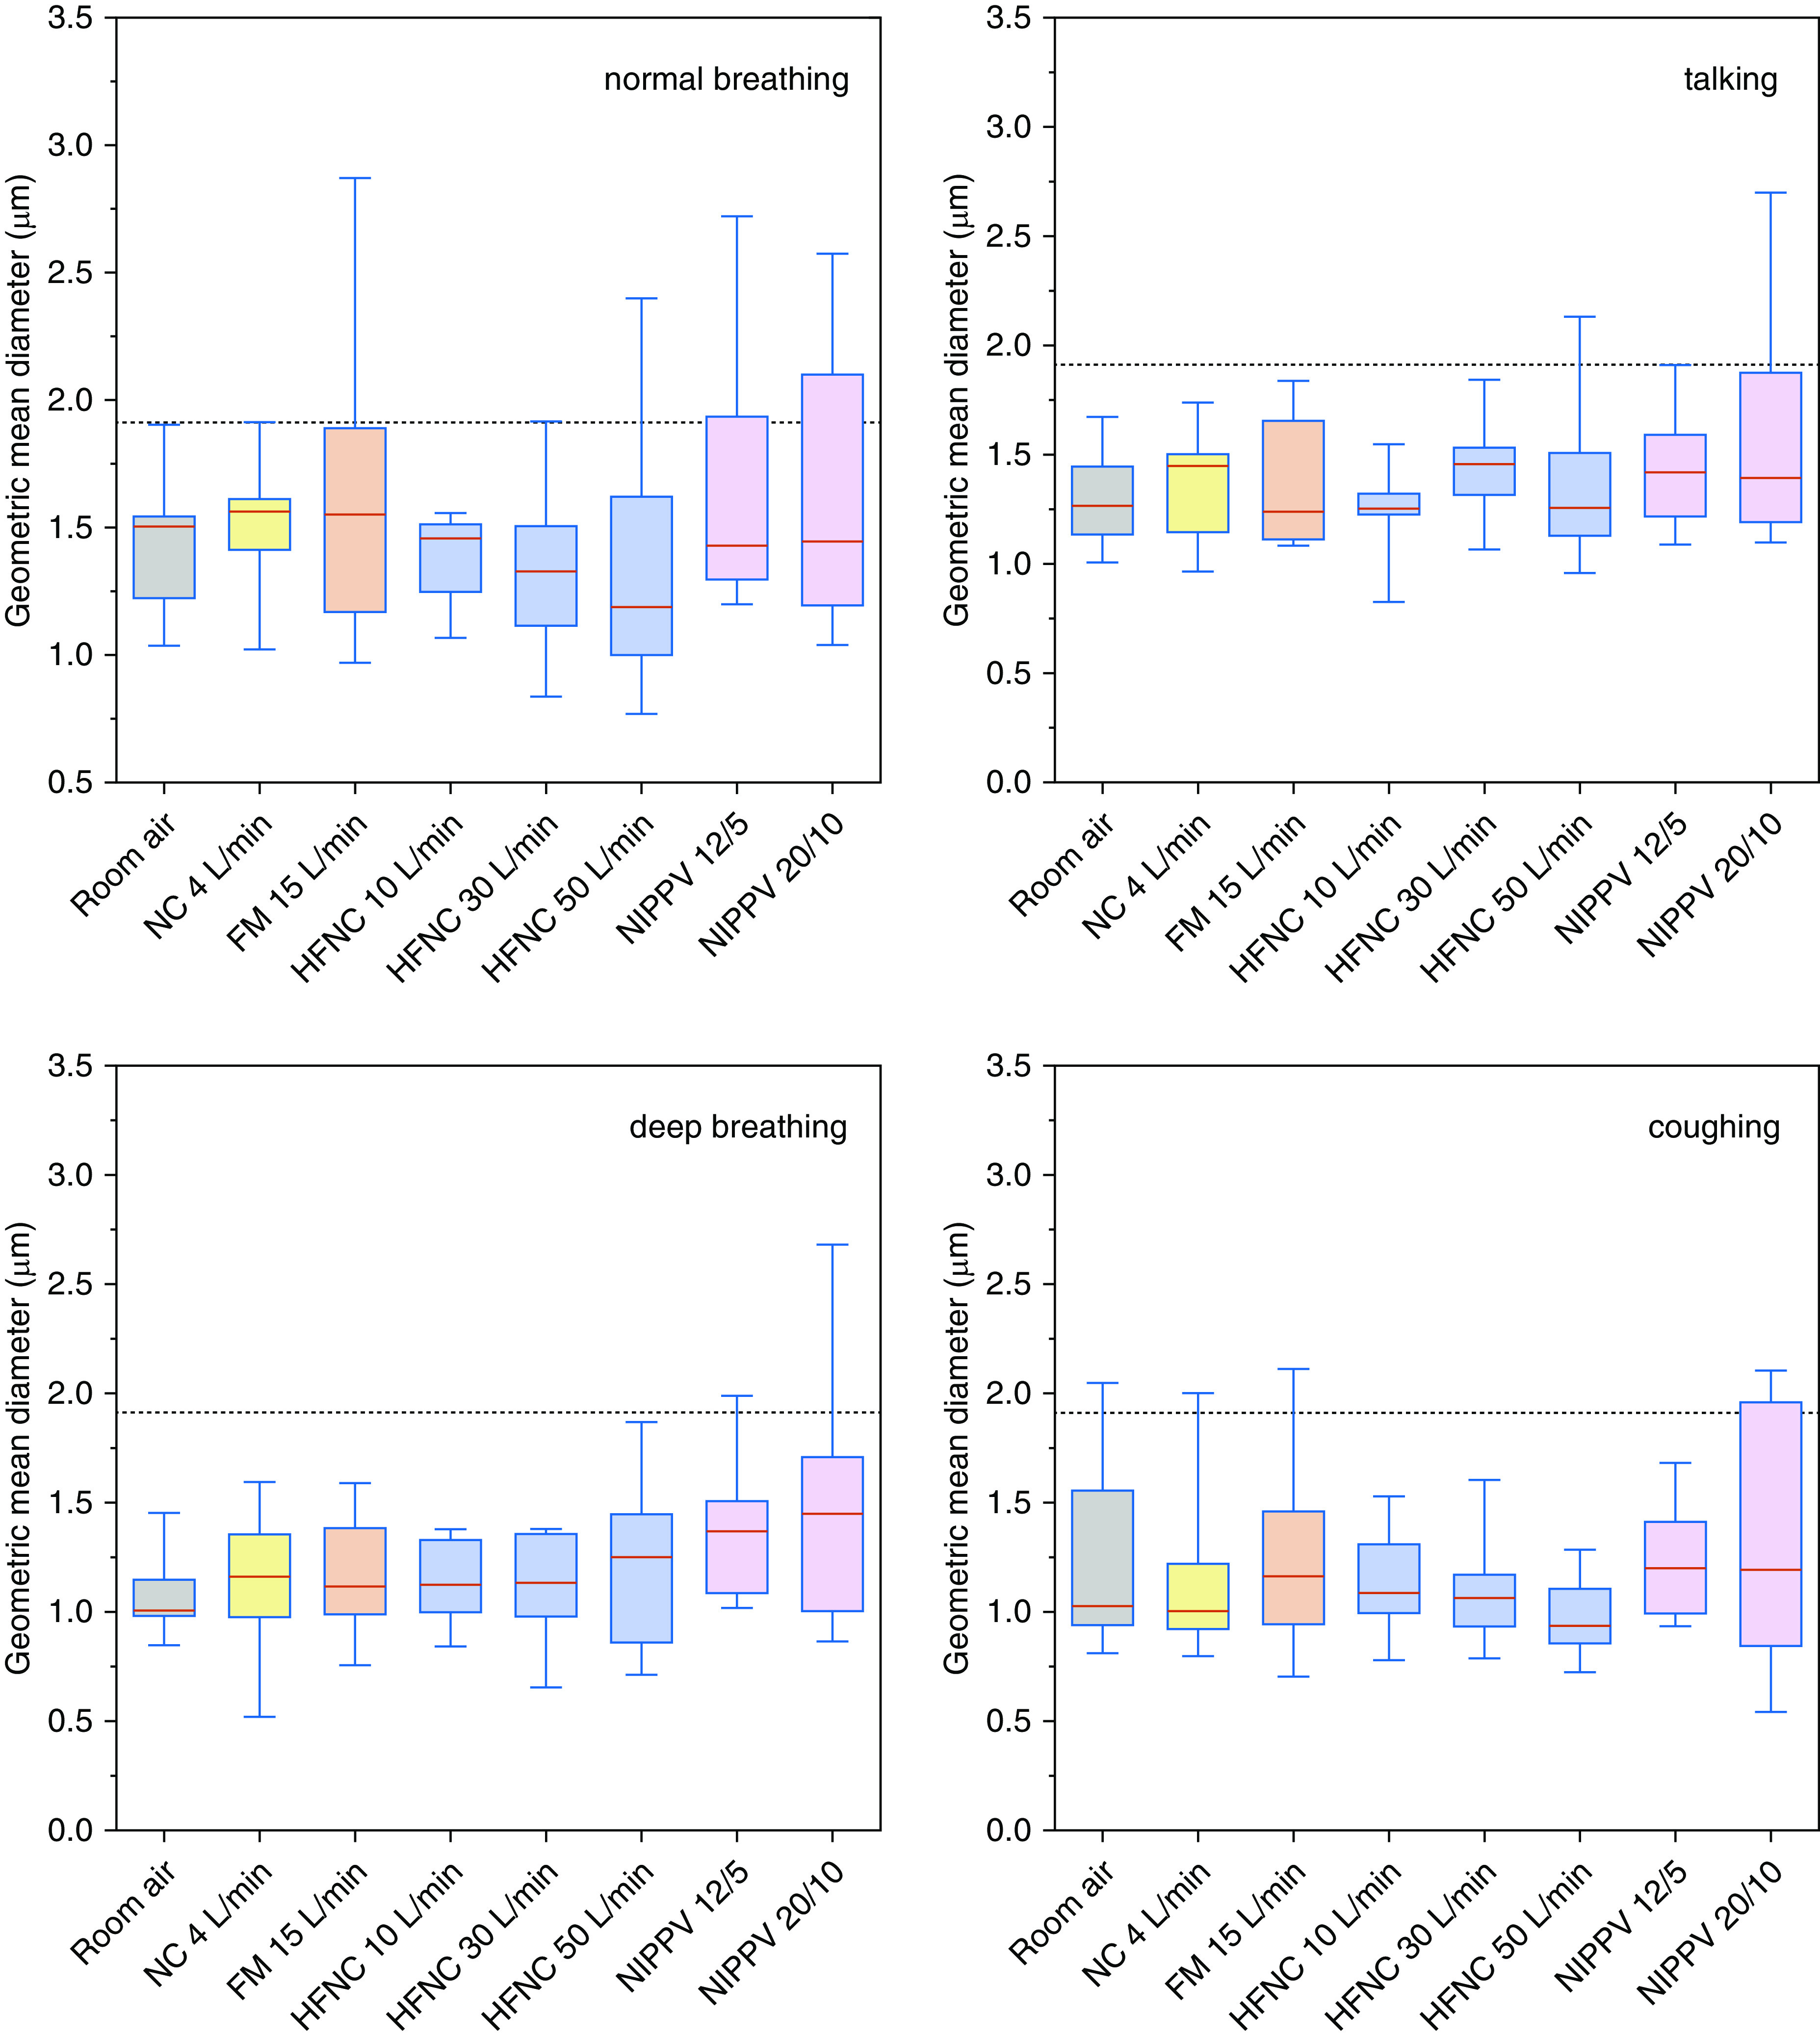
Geometric mean diameter of particles with different modes of oxygen delivery. Box-and-whisker plots demonstrate the median and interquartile ranges. The horizontal dashed line represents the average geometric mean diameter of the particles in the baseline measurements of the room (1.80 μm). For definition of abbreviations, see Figure 1.