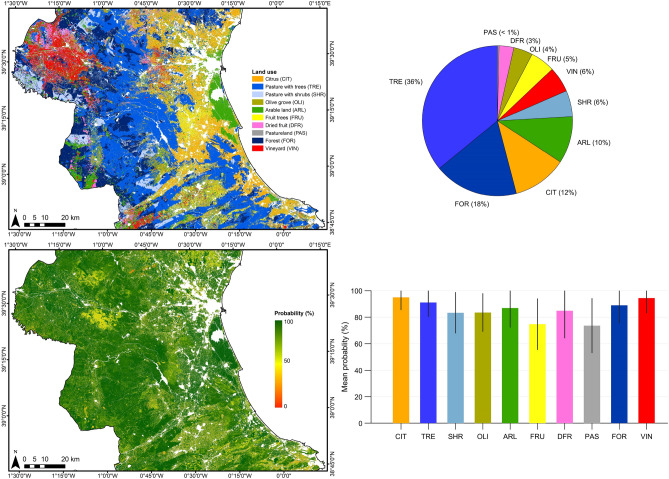
Figure 2.
Classification map derived using the 2-BiLSTM model and the associated spatial distribution (up), and the pixel probability map and associated class mean probabilities (bottom). For the sake of visualisation, parcels belonging to rice, fallow, barley, oat, wheat, sunflower, and triticale have been grouped and displayed as arable land (ARL). Non interest areas have been masked out. Error bars indicate the standard deviation of every class probability. The maps were generated with the Arcmap v.10.5 software (https://desktop.arcgis.com/es/arcmap/).

