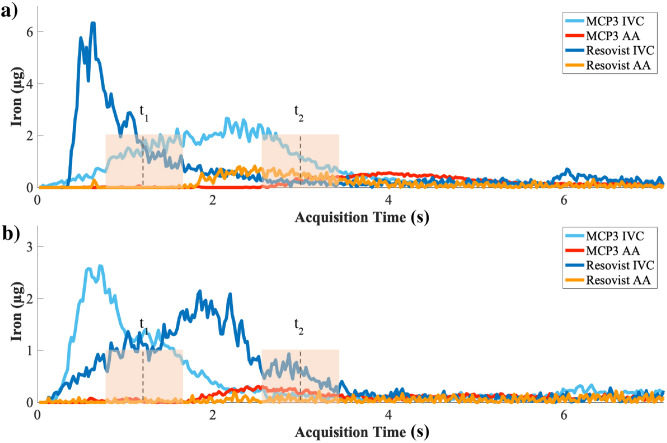
Figure 1.
Iron concentration–time curves of the IVC and first-pass in the AA for both tracers, MCP 3 and Resovist, in the VOI defined in imaging data acquired. Shown are curves for administered doses of 0.1 mmol Fe/kg (a) and 0.05 mmol Fe/kg (b). The iron level of Resovist-based arterial phase in (b) is hardly distinguishable from noise. t1 and t2 indicate the time points when bolus in IVC and arterial phase in AA were further analysed.

