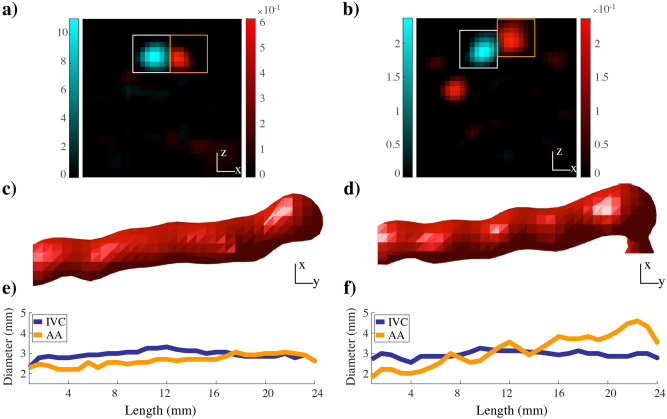
Figure 4.
MPI digital subtraction angiography. Shown are the results for MCP 3 at 0.1 mmol Fe/kg in transverse (a) and coronal orientation (c) and the DL (e) versus the corresponding results for 0.05 mmol Fe/kg (b, d, f). Mean DL is in the range of 2–3 mm. The white square in A and B indicates the IVC VOI and the orange square the AA VOI. The arterial phase is isolated by subtraction of the IVC during the bolus passage through AA. The DL of the AA and abdominal IVC along their longitudinal axes is determined. Color bar values in (a) and (b) are in µg.

