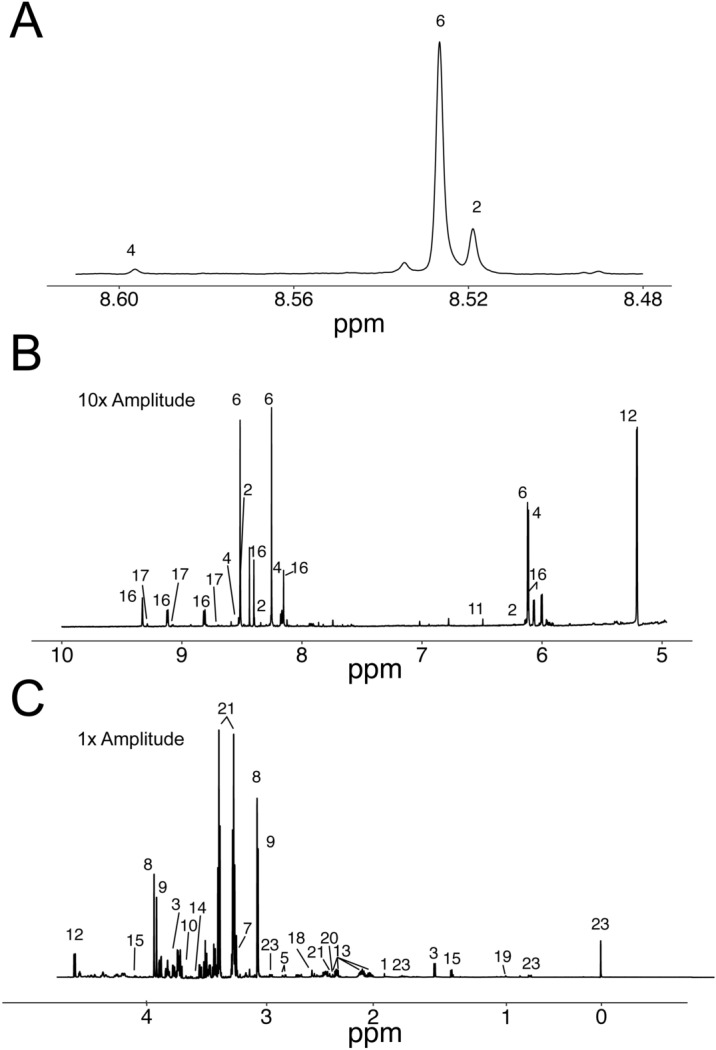
Figure 2.

Representative 1H-NMR spectrum of extracted polar myocardial metabolites. Peaks are labeled as: 1. Acetate; 2. ADP; 3. Alanine; 4. AMP; 5. Aspartate; 6. ATP; 7. Carnitine; 8. Phosphocreatine; 9. Creatine; 10. Ethylene Glycol; 11. Fumarate; 12. Glucose; 13. Glutamate; 14. Glycine; 15. Lactate; 16. NAD(H); 17. NADP(H); 18. Oxalacetate; 19. Pantothenate; 20. Pyruvate; 21; Succinate; 22. Taurine; 23. DSS. Note the spectra containing the residual water peak (4.70 to 4.85 ppm) is not shown. (A) Demonstrates the spectral region of adenine proton following addition of EDTA, note separation between ATP (6) and ADP (2). (B) Spectra represent peaks above the water peak (> 4.8 ppm) are multiplied by 10 to allow peak detail to be observed. (C) Represent peaks below 4.70 ppm.
