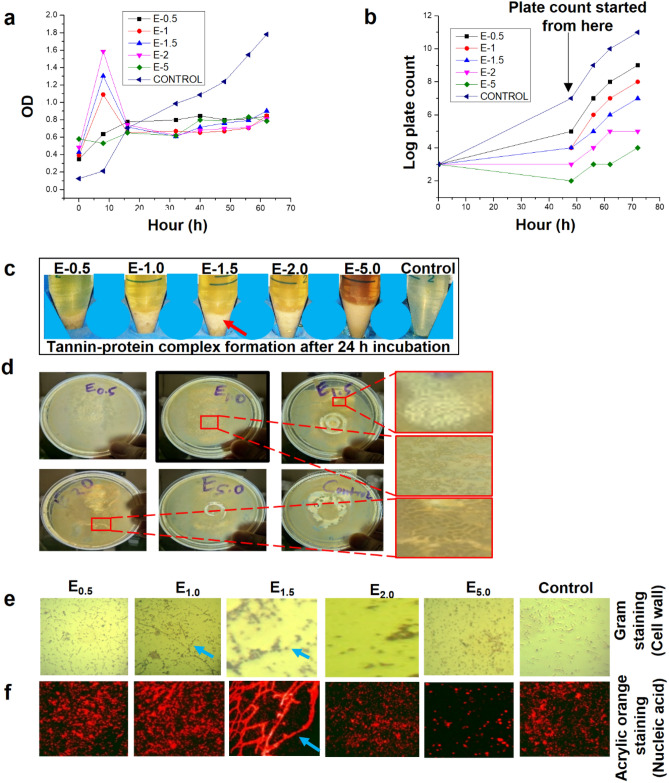
Figure 5.
Response of mixed microbes treated with Eucalyptus extract –PSM and optimization of E-dose (a) Tannin-protein complex formation after 24 h with increasing order of Eucalyptus-dose (indicated by red arrow). (b) Effect of increasing order of Eucalyptus extract-dose on the viability of mixed microbiota represented by plate count (CFC per ml) after 24 h of incubation at 30 ˚C. (c) Represent different morphological growth of microbes, wrinkle and ring structures on petri-plates with increasing order of Eucalyptus-dose. (d) The pale yellow colour pictures are Gram stained microbes and the red colour pictures are nucleic acid stained by acryl orange. The change in cell morphology, filamentous growth and spheroplast formation are displayed with respect to different concentrations of Eucalyptus-doses (0.5 mg, 1.0 mg, 1.5 mg, 2.0 mg and 5.0 mg) per 1 ml of sludge with VSS of 25 g.l-1. (e) Gram staining of mixed microbes (for cell wall). (f) Acrylic orange staining for nucleic acid. Graphs are plotted by using Origin 9.0 software (https://www.originlab.com/).

