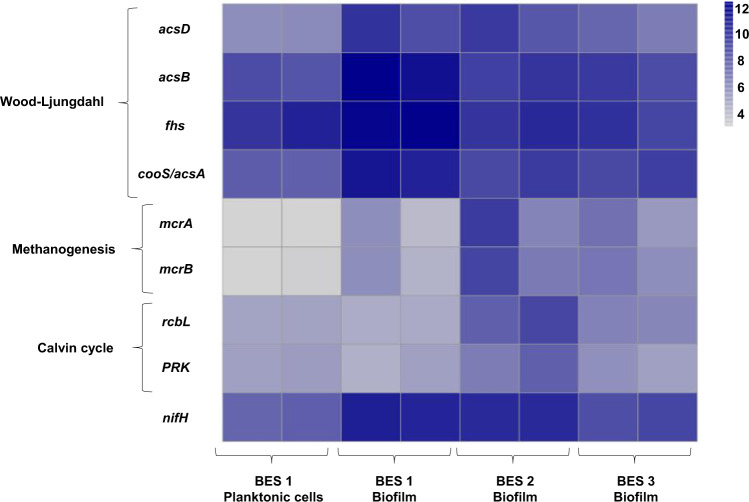
Fig. 9. Heatmap of DESeq2 log transformed and normalized counts of nifH and key genes of three pathways (Wood–Ljungdahl, Methanogenesis and Calvin cycle) dominating biofilm samples of BES 1 (−1.0 V/CO2), BES 2 (−1.0 V/NaHCO3), BES 3 (−0.8 V/CO2), and planktonic cells of BES 1 (−1.0 V/CO2).
Darker shade of blue shows the higher relative gene abundance. The key genes are acsB (Acetyl-CoA synthase), acsD (acetyl-CoA decarbonylase/synthase), fhs (fomrate-tetrahydrofolate), cooS/acsA (anaerobic carbon-monoxide dehydrogenase catalytic subunit), mcrA (Methyl-coenzyme M reductase alpha subunit), mcrB (methyl-coenzyme M reductase beta subunit), rbcl (ribulose-bisphosphate carboxylase large subunit) and PRK (phosphoribulokinase).

