Figure 3.
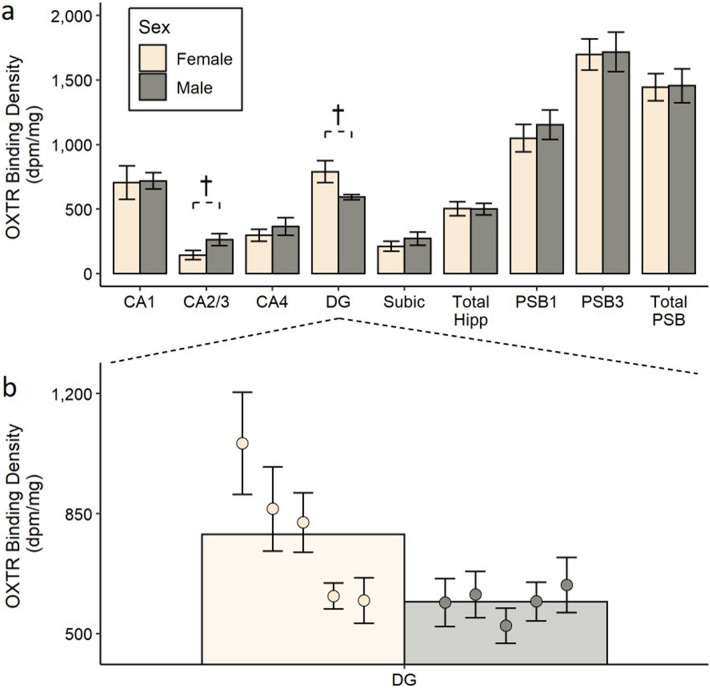
No sex differences in OXTR binding in the hippocampus or presubiculum. The top panel (a) shows the average OXTR binding density for males and females in each brain region quantified, and error bars indicate ± 1 standard error. †The p value for the group comparison is < 0.10. The bottom panel (b) shows a zoomed view of the average OXTR binding density in the dentate gyrus for males and females (bars), with the average OXTR binding for each subject (circles) overlaid on top. The error bars in this panel correspond to the ± 1 standard error across the different sections that were averaged for each subject. dpm disintegrations per minute, CA1, CA2/3, CA4 CA fields of the hippocampus, DG dentate gyrus, Subic subiculum, Total Hipp total hippocampus area (including CA1, CA2/3, CA4, DG, and Subic) , PSB1 presubiculum layer 1, PSB3 presubiculum layer 3, Tot. PSB total presubiculum area (including PSB1 and PSB3).

