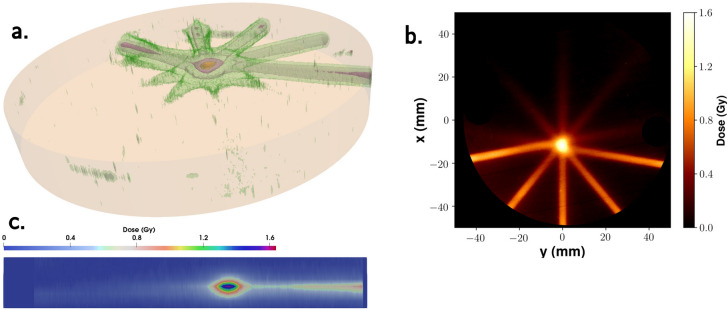
Figure 3.
Experimental dose distribution retrieved from experimental data in the MF irradiation case. a Isodose surfaces: green: 0.2 Gy, grey: 0.4 Gy, pink: 0.8 Gy, yellow: 1.2 Gy, red: 1.4 Gy As a visual aid, the light orange cylinder stands for the phantom. b 2D slice along the z direction (see Fig. 1 for the coordinate system used), taken at the (z constant) position of the e-beam. c 2D slice along the y direction, taken at the (y constant) position corresponding to the center of the central field.

