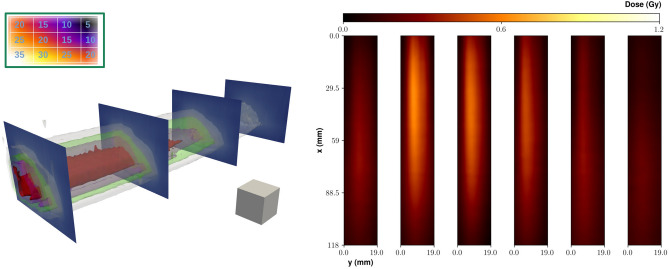
Figure 5.
Top left inset: Number of shots used on each point of a array of positions; the distance between neighbour positions was 3 mm. Left: Isodose surfaces for selected dose values retrieved in the IM experiment. Red: 1.0 Gy; pink: 0.8 Gy; green: 0.6 Gy; grey: 0.4 Gy. As a visual aid, slices at different depths (20, 40 and 60 mm) are also shown. A small cube with 5 mm size is also shown as a spatial scale reference. Right: 2D maps of the experimental dose distribution retrieved on each gafchromic film in the IM experiment. The distance between adjacent layers was 2 mm.

