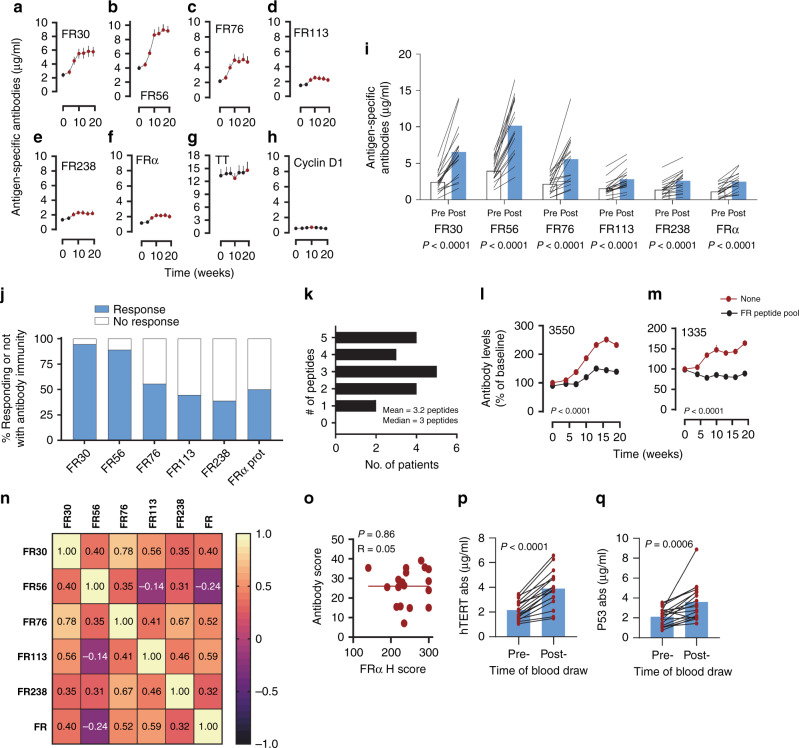
Fig. 3. DC vaccines induce cognate antibody immunity.
a–h Induction phase times courses of antigen-specific antibody levels (μg/ml, mean + s.e.m.) for FRα epitopes FR30, FR56, FR76, FR113, FR238 and FRα protein, TT, and control cyclin D1 peptide, respectively, in 18 evaluable patients. Reddened symbols indicate P < 0.008 (Bonferroni corrected) significance by Wilcoxon matched pairs two-sided test, compared to the baseline value for that antigen. Exact P values are indicated in Supplementary Table 7. i The mean (n = 18) pre-immunization (Pre) and highest post-vaccination (Post) frequency of antigen-specific antibody levels (μg/ml) to the vaccine epitopes as well as the whole FRα protein. Post-vaccination samples included up to week 19. P values were calculated using the two-sided test Wilcoxon matched pairs at a significance level of P ≤ 0.05. j % of patients that responded to vaccine epitopes with antibody responses at the ≥2-fold increase threshold. k The distribution of antibody responses to the individual epitopes. l, m Levels of FRα protein-specific antibodies over the time course of the 19-week vaccine period, expressed a % of baseline, for two patients. Plasma was left either untreated (red line) or pre-absorbed (black line) with pooled vaccine peptides prior to ELISA. Each data symbol represents mean (+s.e.m.) of two replicates. P values were calculated using two-sided two-way analysis of variance. n Correlation heatmap comparing the magnitude of maximal peptide-specific antibody levels to the maximal FRα protein-specific and epitope-specific antibody levels. Inset values are Spearman’s Rho. Correlations >0.56 were P < 0.05 (Benjamini-Hochberg two-sided adjusted P values). Exact P values are indicated in Supplementary Table 8. o Correlation plot between the vaccine antibody score (sum of the individual patients response to each epitope) and tumor FRα expression. Inset values are Pearsons’s Rho coefficient and P value. Each symbol represents a unique patient and the inset line is best-fit lines was calculated with non-linear least squares regression and intended for data trend visualization. p, q Pre- and post-immunization (19-week time point) serum levels of IgG antibodies specific for p53 and hTERT, respectively, in each of the 18 patients. Inset blue bar represents the mean levels of antibodies for all patients at pre- and post-immunization. P values comparing the means were calculated with a two-sided paired Student’s t test.

