Figure 4.
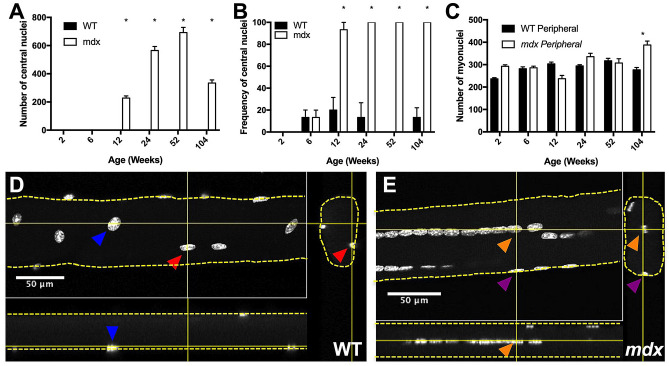
Mdx EDL myofibers have a high number and frequency of central nuclei relative to WT. (A) Mdx myofibers accrue progressively more central nuclei throughout the first year of life. Central nuclei number decreases in the second year of life, coincident with a decrease in total myonuclear number. (B) Frequency of myofibers containing central nuclei at any point along their length. By 24 weeks of age 100% of mdx myofibers contain central nuclei. (C) Mdx and WT myofibers have same number of peripheral nuclei through the first year of life. This indicates that central nuclei account for hypernucleation in mdx. (D) Confocal image of a 24-week-old WT myofiber containing peripheral nuclei with orthogonal views. Solid yellow lines indicate virtual slices. Dashed yellow lines outline myofibers. Color coated arrowheads identify the same myonucleus from different views. (E) Confocal image of a 24-week-old mdx myofiber containing peripheral and central nuclei with orthogonal views. Solid yellow lines indicate virtual slices. Dashed yellow lines outline myofibers. Orange arrowheads identify a central nucleus from different views. Purple arrowheads identify a peripheral nucleus from different views. Scale bars = 50 μm. N = 3 mice and 30 myofibers per group. Analysis via two-way ANOVA with Tukey post hoc test. * = p < 0.05. All data sets are displayed as mean ± s.e.m.

