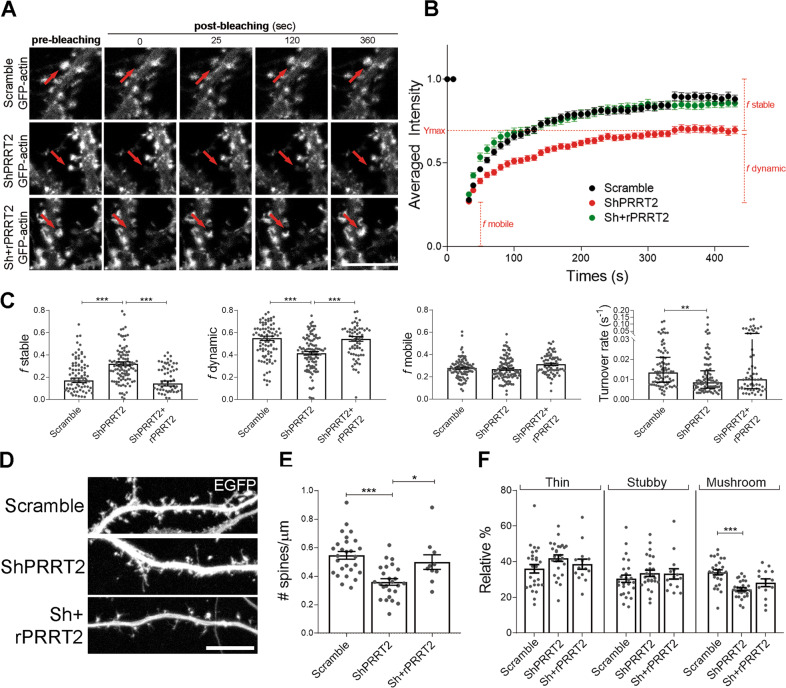
Fig. 4. Knockdown of PRRT2 in hippocampal neurons disrupts F-actin polymerization and perturbs dendritic spine density and morphology.
A Representative frames of prebleaching and postbleaching phases of EGFP-actin signals of live-imaged Scramble, ShPRRT2 or Sh+rPRRT2 transduced neurons. The regions of interest (ROI; diameter = 1.3 µm) are indicated by red arrows. Scale bar: 5 μm. B Quantitative analysis of the relative fluorescence intensity of EGFP-actin measured in the ROI over time, normalized to the mean signal measured in the prebleaching phase. Data are expressed as mean ± SEM for the fractions and median ± interquartile range for the turnover rate of n = number of spines from 4 independent experiments (Scramble = 92, ShPRRT2 = 103, Sh+rPRRT2 = 70). C Fraction of EGFP-actin in stable (f stable), dynamic (f dynamic) or mobile (f mobile) forms and the turnover rate of actin filaments in the absence or presence of PRRT2. In red are indicated the fractions referred to the ShPRRT2 curve. f stable: Scramble = 0.17 ± 0.02, ShPRRT2 = 0.32 ± 0.02, Sh+rPRRT2 = 0.14 ± 0.02; f dynamic: Scramble = 0.55 ± 0.02, ShPRRT2 = 0.42 ± 0.02, Sh+rPRRT2 = 0.54 ± 0.02; f mobile: Scramble = 0.28 ± 0.01, ShPRRT2 = 0.27 ± 0.01, Sh+rPRRT2 = 0.31 ± 0.01. Data are expressed as mean ± SEM of n = number of spines. One-way ANOVA/Bonferroni’s tests; **p < 0.01, ***p < 0.001. Median turnover rate (s−1): Scramble = 0.0135, ShPRRT2 = 0.0085, Sh+rPRRT2 = 0.0101; Kruskal–Wallis/Dunn’s tests: **p < 0.01. D Representative images of 14 DIV hippocampal neurons infected at 7 DIV with mCherry-tagged Scramble, ShPRRT2, or Sh + Sh-resistant PRRT2 (Sh+rPRRT2) lentiviruses. EGFP was transfected at 4 DIV to visualize cell profiles. Scale bar: 10 μm. E Quantitative analysis (means ± SEM) of the number of dendritic spines per μm of neurite (spine density) in neurons treated as in D, detected with the NeuronStudio software. Mean spine density ± SEM: Scramble = 0.55 ± 0.02, ShPRRT2 = 0.34 ± 0.03, Sh+rPRRT2 = 0.48 ± 0.05; p < 0.001 Scramble vs ShPRRT2, p < 0.05 ShPRRT2 vs Sh+rPRRT2. F Morphometric analysis of dendritic spines. The percent distribution of thin, stubby and mushroom spines is shown.: Scramble = 36 ± 2, ShPRRT2 = 42 ± 2, Sh+rPRRT2 = 38 ± 3; percentage of spines: Scramble = 30 ± 2, ShPRRT2 = 34 ± 2, Sh+rPRRT2 = 33 ± 3; percentage of spines: Scramble = 34 ± 1, ShPRRT2 = 24 ± 1, Sh+rPRRT2 = 28 ± 2; p < 0.001 Scramble vs ShPRRT2. Data in E and F are shown as means ± SEM of n = total number of neurons from 3 independent experiments (Scramble = 27, ShPRRT2 = 27, Sh+rPRRT2 = 14). One-way ANOVA/Bonferroni’s tests; *p < 0.05, ***p < 0.001.

