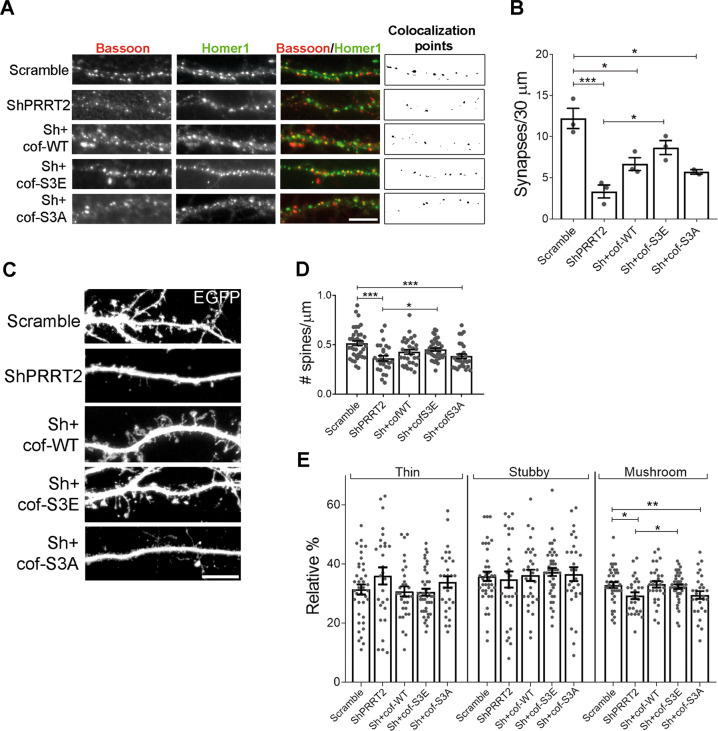
Fig. 6. Expression of a constitutively inactive form of cofilin in hippocampal neurons rescues the phenotype induced by PRRT2 knockdown.
A Representative dendrites of hippocampal neurons infected at 7 DIV with mCherry-tagged Scramble or ShPRRT2 in the presence or absence of wild-type (cof-WT), dephospho-mimetic (S3A) or phospho-mimetic (S3E) cofilin and analysed at 14 DIV. Synaptic boutons were identified by double immunostaining for Bassoon (red) and Homer1 (green). The colocalization panel highlights 0.1–1 µm2 double-positive puncta (black) corresponding to synapses. Scale bar: 10 µm. B Quantitative analysis of synaptic puncta counted on 30-µm dendrite segments starting from the cell body in neurons treated as in A. Mean synapses/30 μm ± SEM: Scramble = 12.22 ± 1.22, ShPRRT2 = 3.34 ± 0.78, Sh+cof-WT = 6.67 ± 0.77, Sh+cof-S3E = 8.68 ± 0.85, Sh+cof-S3A = 5.72 ± 0.28; p < 0.001 Scramble vs ShPRRT2, p < 0.05 Scramble vs Sh+cof-WT, p < 0.05 Scramble vs Sh+cof-S3A, p < 0.05 ShPRRT2 vs Sh+cof-S3E. Data are expressed as means ± SEM from n = 3 independent experiments. One-way ANOVA/Bonferroni’s tests; *p < 0.05, ***p < 0.001. C 14 DIV dendrites of hippocampal neurons transfected with EGFP at DIV 4 to visualize dendritic spines. At 7 DIV neurons were infected as reported in A. Scale bar: 10 μm. D Quantitative analysis of spine density and E morphometric analysis of dendritic spines. Mean spine density ± SEM: Scramble = 0.51 ± 0.02, ShPRRT2 = 0.36 ± 0.03, Sh+cof-WT = 0.42 ± 0.02, Sh+cof-S3E = 0.45 ± 0.01, Sh+cof-S3A = 0.38 ± 0.02; p < 0.001 Scramble vs ShPRRT2, p < 0.001 Scramble vs Sh+cof-S3A, p < 0.05 ShPRRT2 vs Sh+cof-S3E. Relative % thin spines: Scramble = 31 ± 2, ShPRRT2 = 36 ± 3, Sh+cof-WT = 31 ± 2, Sh+cof-S3E = 31 ± 1, Sh+cof-S3A = 34 ± 2; relative % stubby spines: Scramble = 36 ± 2, ShPRRT2 = 35 ± 3, Sh+cof-WT = 36 ± 2, Sh+cof-S3E = 37 ± 1, Sh+cof-S3A = 37 ± 2; relative % mushroom spines: Scramble = 33 ± 1, ShPRRT2 = 29 ± 1, Sh+cof-WT = 33 ± 1, Sh+cof-S3E = 32 ± 1, Sh+cof-S3A = 30 ± 2; p < 0.05 Scramble vs ShPRRT2, p < 0.01 Scramble vs Sh+cof-S3A, p < 0.05 ShPRRT2 vs Sh+cof-S3E. Data in D and E are shown as means ± SEM of n = total number of neurons from 5 independent experiments (total number of neurons: Scramble = 39, ShPRRT2 = 28, Sh+cof-WT = 31, Sh+cof-S3E = 41, Sh+cof-S3A = 29). One-way ANOVA/Bonferroni’s tests; *p < 0.05, **p < 0.01, ***p < 0.001.

