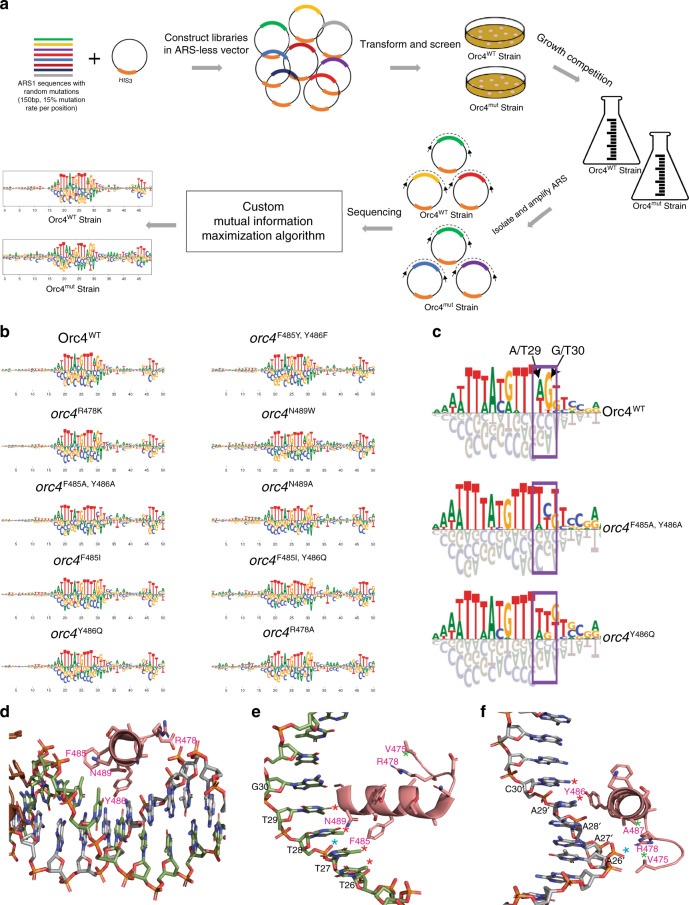
Fig. 2. Selected origin sequence changes using a massively parallel origin selection (MPOS) assay.
a Schematic diagram of the MPOS assay. b ARS motifs for Orc4-integrated variants at A and B1 elements generated using an ARS1 (ARS416) variant library. See “Methods” for how motifs are graphically rendered. c Magnified view of the A element region in b from Orc4WT, orc4F485A, Y486A, orc4Y486Q strains. Dark purple rectangles indicate the major changes at positions 29–30 in the Orc4 mutant strains. d Top-view of Orc4 α-helix insertion from ORC–DNA structure at 3 Å (PDB code 5zr1) positioned in the DNA major groove. F485, Y486, N489, and R478 interact with DNA in base-specific (specificity) and base-nonspecific (affinity) manner. e and f Same as in d, but viewed at different angles. Red asterisks denote the base-specific interactions between amino acid and DNA base. Blue asterisks denote the base-nonspecific interaction between amino acid and DNA phosphate backbone. Green asterisks denote the interaction between amino acids. Prime symbols denote bases on the opposite strand. Bases numbering denotes the positions in the logo (see b). e Shows the hydrophobic interaction between F485 and T-rich region T26–T29, base-specific interaction between N489 and T28, base-nonspecific interaction between N489 and phosphate backbone of T28, and R478 interaction with V475. f Shows the aromatic edge-face interaction between Y486 and A29′ on the opposite strand, hydrophobic interaction between Y486 and C30′, base-nonspecific interaction between R478 and phosphate backbone of A27′, and R478 interaction with A487 and V475.

