
Fig. 2.
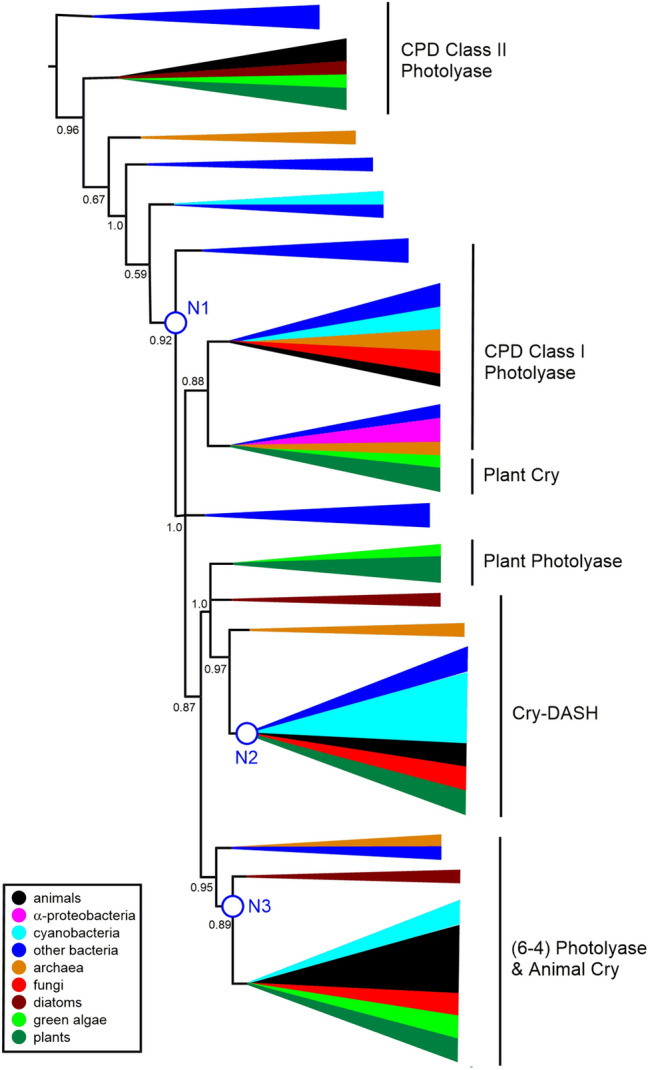
Schematic phylogenetic tree from MUSCLE alignment. The full tree is in Supplementary Figure S1. aLRT-SH over 0.5 are shown, with branches below 0.5 being collapsed. We have not attempted to precisely define the different clades, but have indicated the locations of the main subfamilies with reference to Fig. 1 and Mei and Dvornyk (2015). N1–N3 refer to the three nodes discussed in the manuscript. The Figure highlights the positions of animal sequences (in black) relative to α-proteobacterial sequences (in magenta) and cyanobacterial sequences (in cyan). Also colour coded are sequences from other bacteria (blue), archaea (orange), fungi (red), diatoms (brown), green algae (light green) and plants (dark green) (Color figure online)