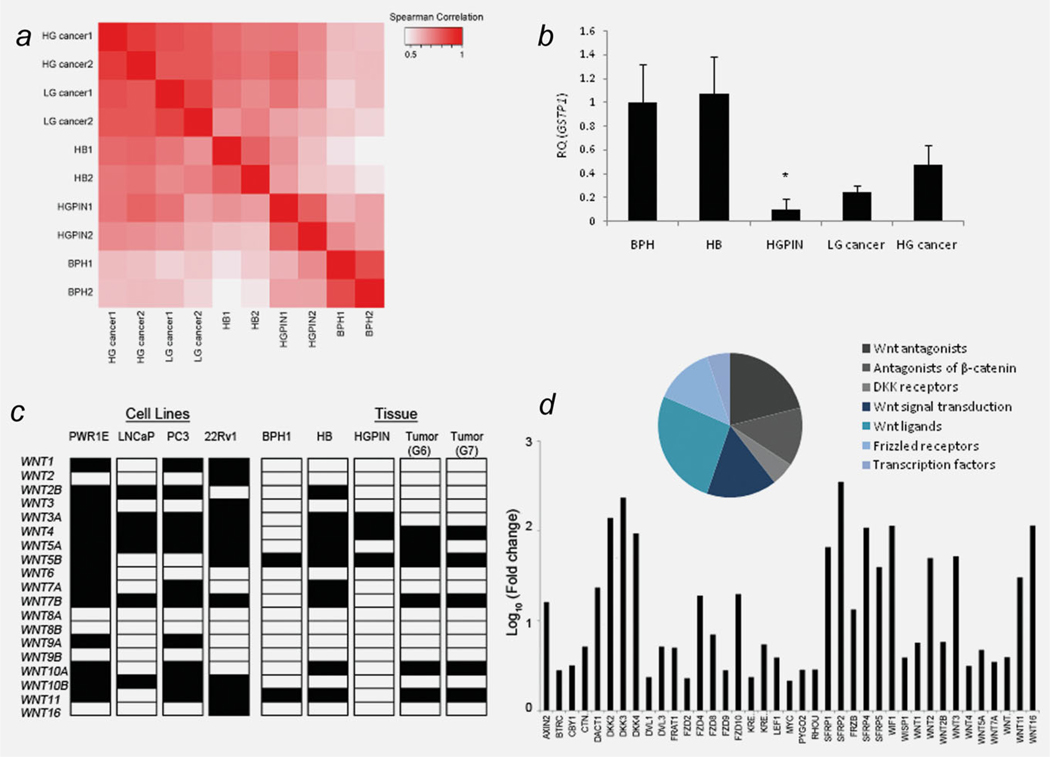
Figure 1.
Wnt signaling expression profiling in prostate cancer. (a) Heatmap providing visual summary of the Spearman correlation matrix of biological groups, calculated on normalized RT-PCR data. Each sample type (HB, BPH, high grade cancer (HGcancer), low grade cancer (LGcancer)) and HGPIN has two biological replicates. (b) Fold change in GSTP1 expression relative to BPH. *p < 0.05. (c) Expression of 19 human WNT genes in prostate cell lines and tissue specimens by qRT-PCR. Filled square indicates expression, open square indicates no expression. (d) Genes upregulated in PC-3 cells by pharmacological demethylation.

