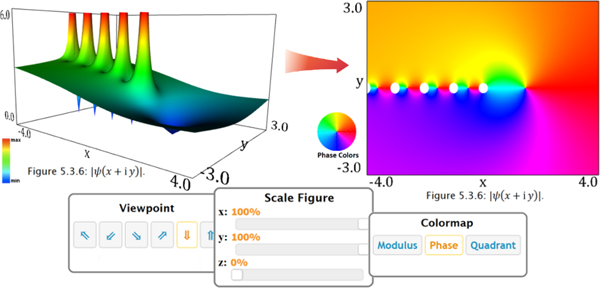
Figure 5. Density plots.
Options may be combined to produce graphical displays that illuminate significant function features more clearly. The graph on the left represents the modulus of the complex digamma, or psi function, defined by ψ(x + iy) = Γ′(x + iy)/Γ(x + iy). A user can construct a density plot by viewing the surface from the top and rescaling the vertical axis to zero. Selecting the phase color map then yields a density plot based on the phase, or arg, values as seen in the image on the right. Like the gamma function, the psi function has simple poles at the negative integers. When one moves counter-clockwise around a pole, that is, in our image, around the holes shown along the negative real axis, one travels clockwise one full rotation around the color wheel, indicating a phase change of 2π. However, unlike the gamma function, the psi function has zeros between the poles. Around the zeros, the direction of the colors is reversed, indicating that the phase sign is opposite to that around the poles. DLMF Physical Sciences Editor Charles Clark observed that the pattern is analogous to what one would see in fluid flow generated by a semi-infinite line of vortices with alternating lines of circulation, producing a near cancellation of flow far from the real axis. One can see the contrast with the gamma function, where there are poles but no zeros in-between, by creating a phase density plot using the gamma function visualization in the DLMF Gamma Function chapter.

