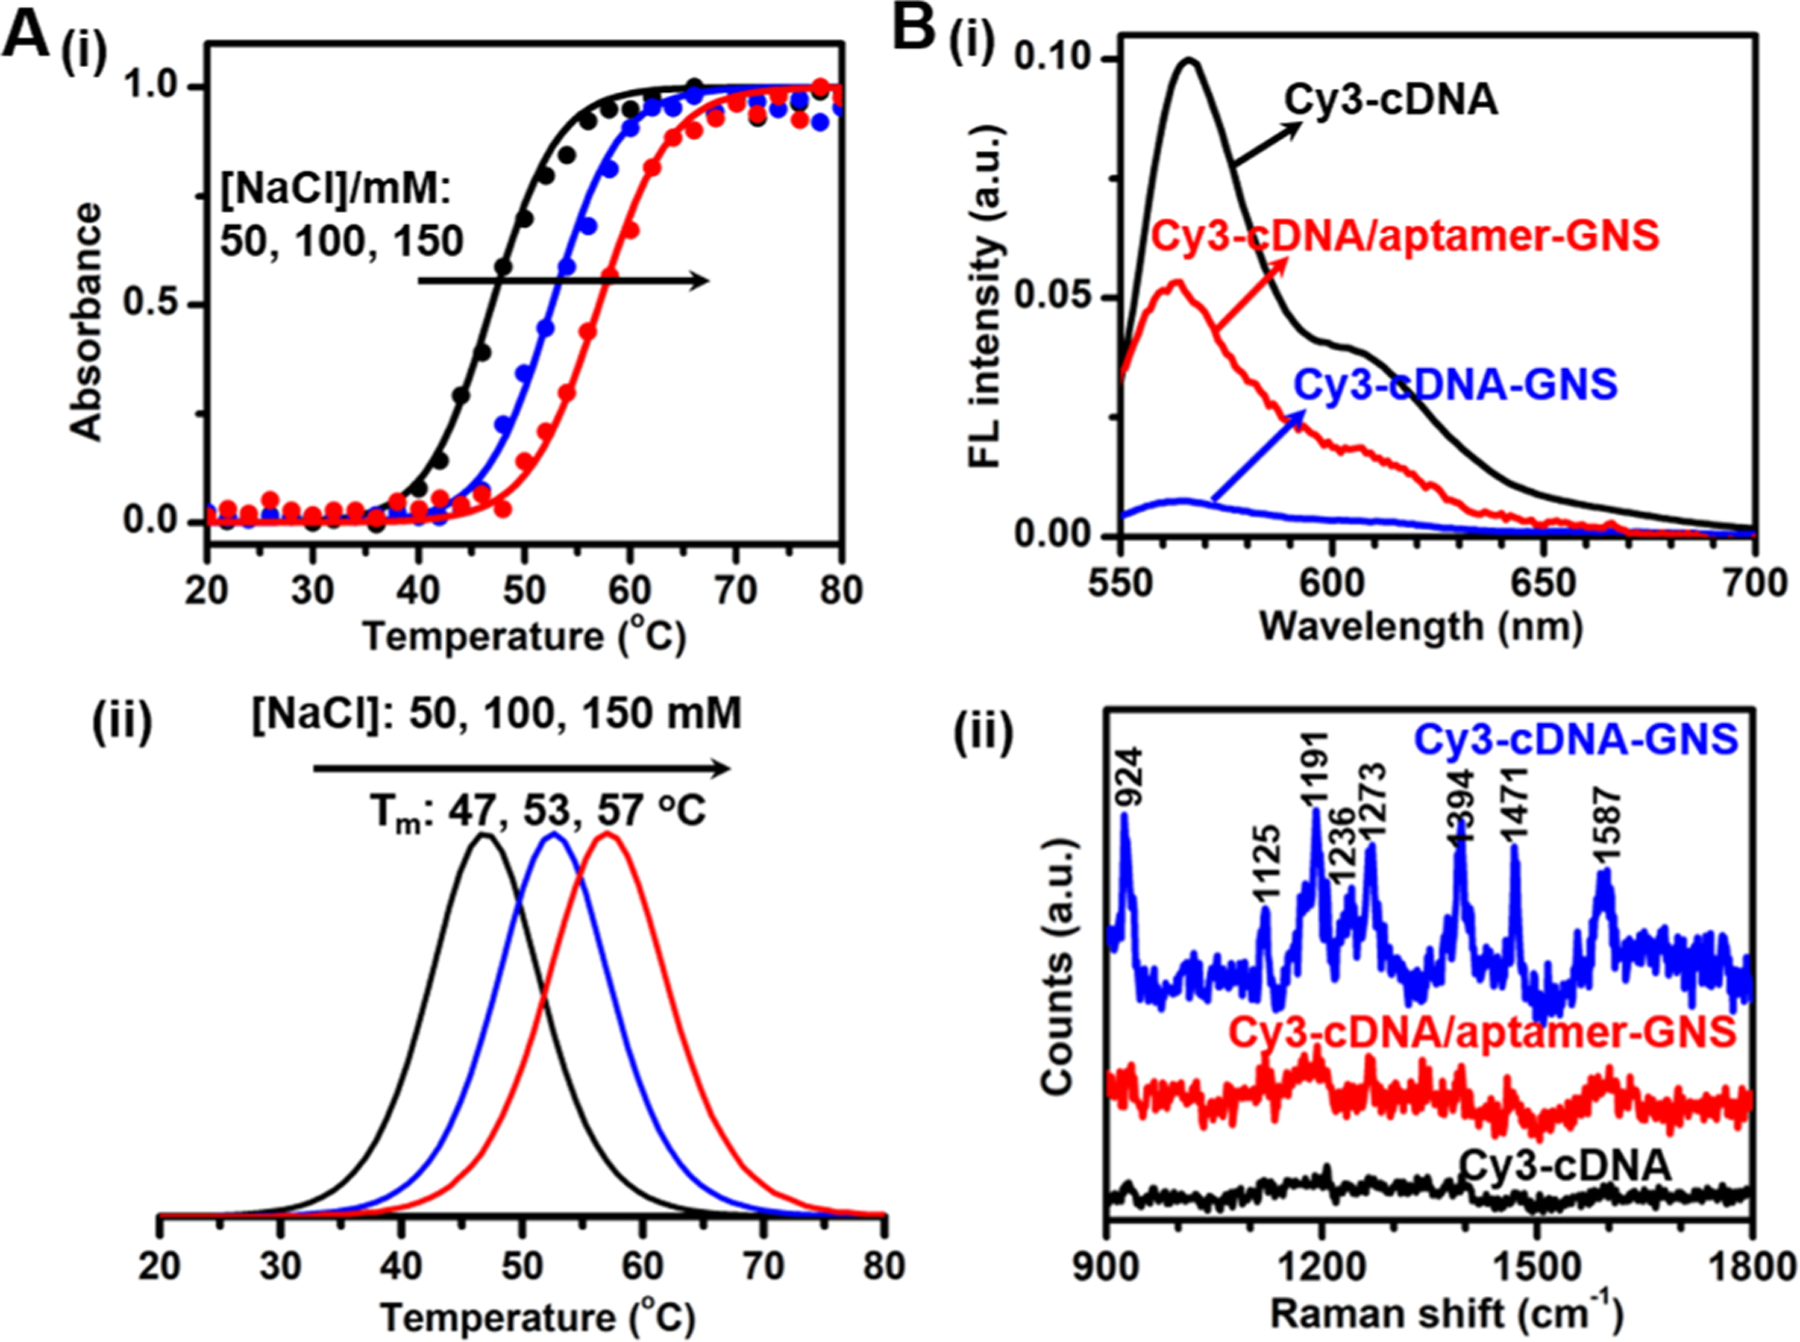
Figure 2.

(A) Melting profiles of Cy3-cDNA/aptamer-GNS conjugates in 25 mM Tris acetate buffer solutions containing 50, 100 or 150 mM NaCl. The bottom panel (ii) shows the first derivatives of the corresponding melting curves (i, top). (B) (i) Fluorescence and (ii) SERS spectra of Cy3-cDNA (black), Cy3-cDNA-GNS conjugates (blue) and Cy3-cDNA/aptamer-GNS conjugates (red). Both fluorescence and SERS spectra of Cy3-cDNA are acquired with a concentration of 3.3 μM MC-LR. Spontaneous Raman spectrum of Cy3-cDNA is measured with a 60 mW laser power and 5 s integration time, and SERS spectra of Cy3-cDNA-GNS conjugates and Cy3-cDNA/aptamer-GNS conjugates were measured with a 5 mW laser power and 1 s integration time.
