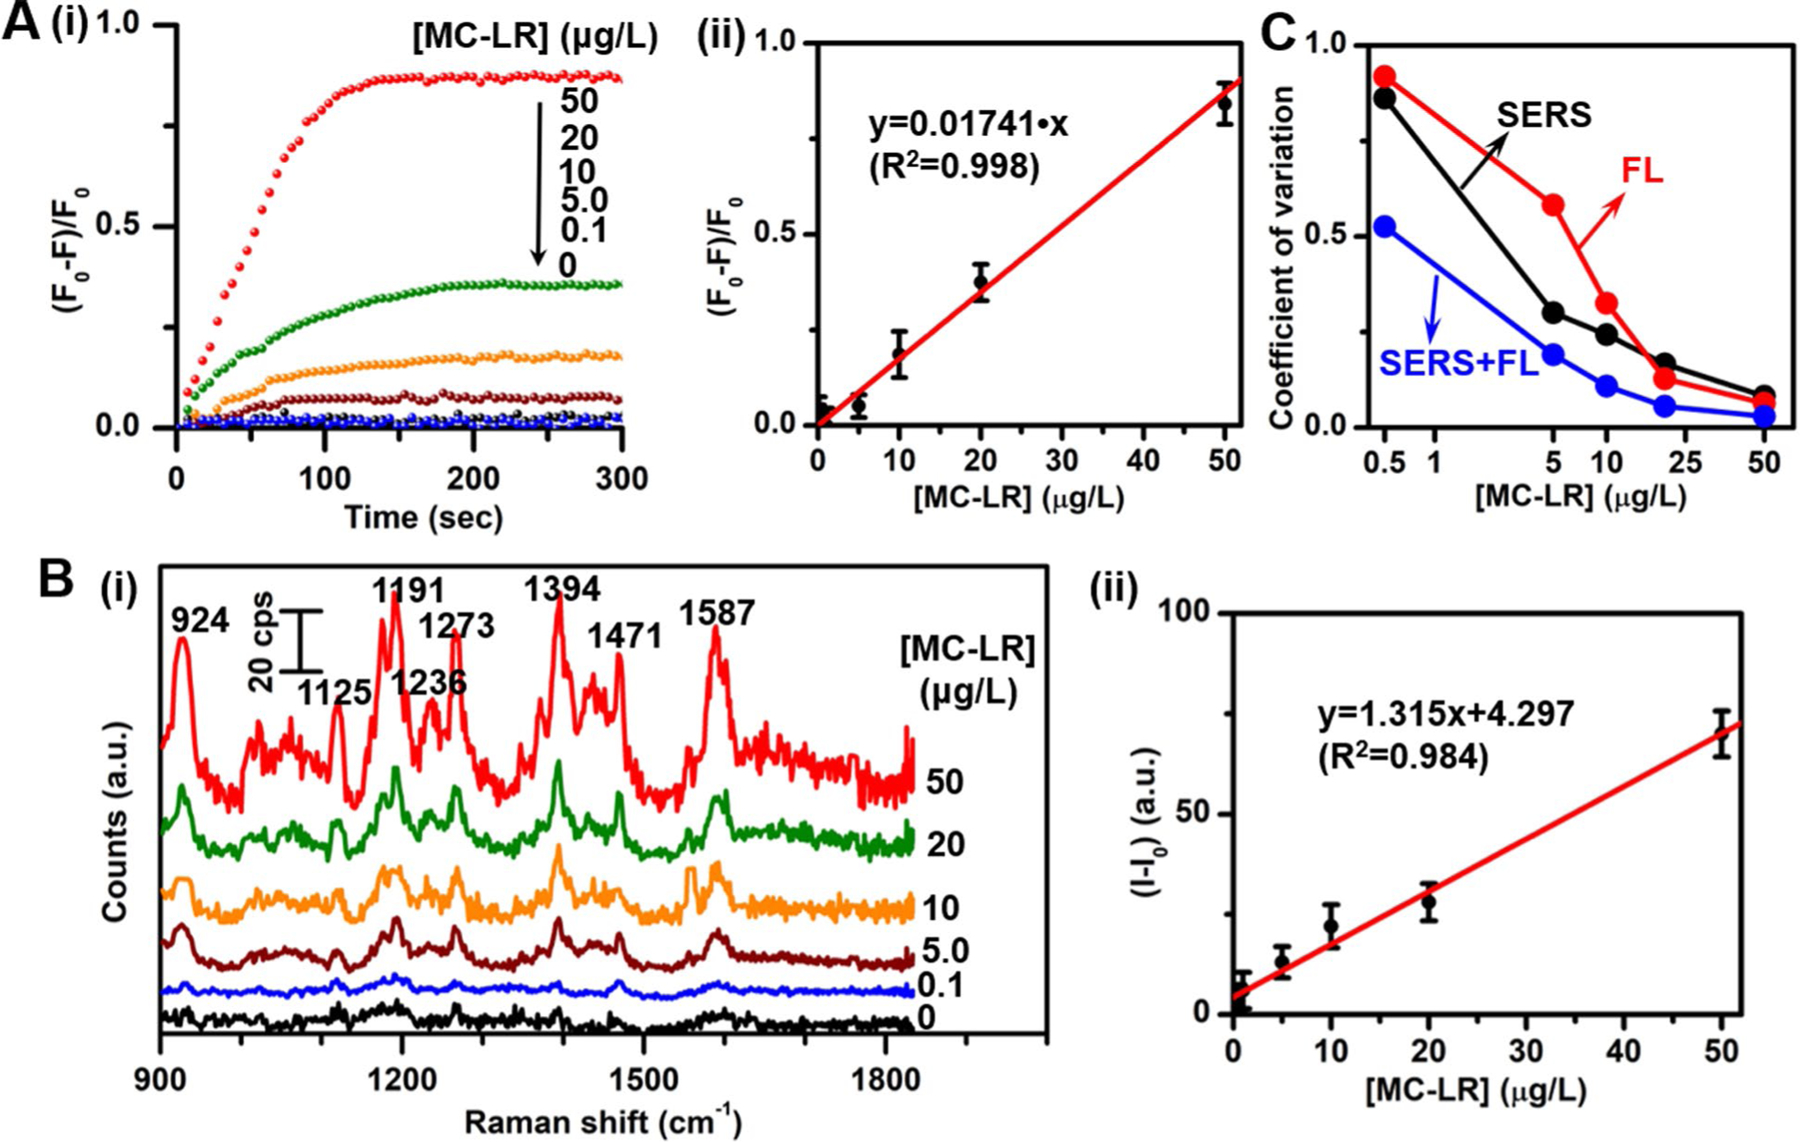
Figure 3.

(A) (i) Real-time fluorescence response ((F0-F)/F0) of the present aptasensor with respect to the initial (time=0) fluorescence intensity (F0) at 565 nm and (ii) calibration curve of the relative fluorescence intensity change ((F0-F)/F0) at 565 nm as a function of the MC-LR concentration. (B) (i) SERS spectra and (ii) calibration curve of SERS intensity at 1394 cm−1 as a function of the MC-LR concentration. (C) Coefficient of variation of SERS, fluorescence and the combined dual-modal detection of the present aptasensor.
