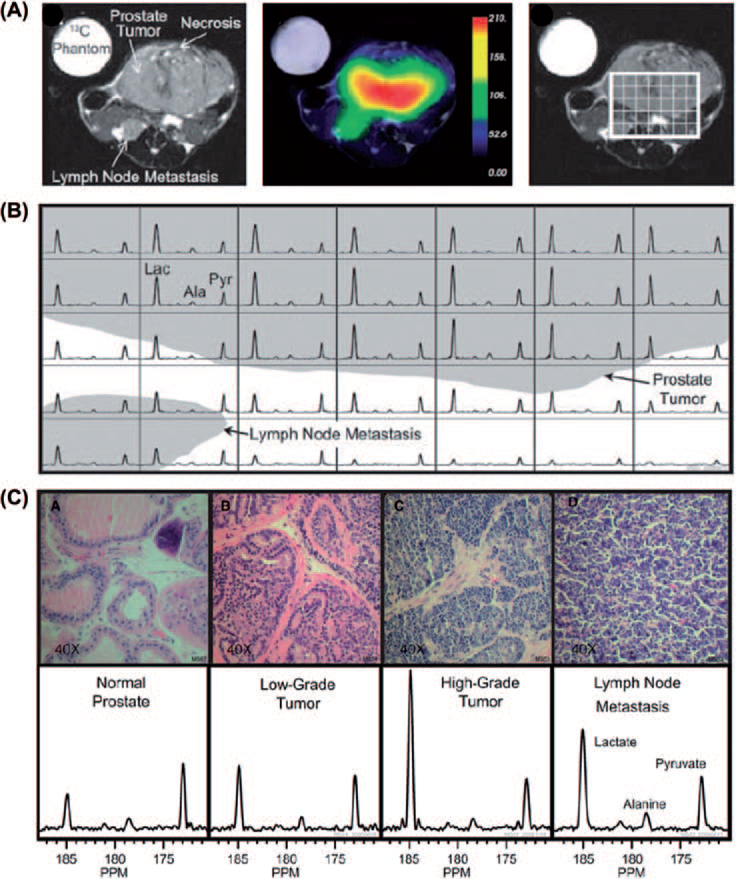
Figure 3.
Hyperpolarized 13C metabolic images of a TRAMP mouse. Upper: Hyperpolarized 13C lactate image following the injection of hyperpolarized [1-13C]pyruvate, overlaid on T2-weighted 1H image. Middle: Hyperpolarized 13C spectra of primary and metastatic tumor regions. Lower: Representative H&E-stained sections and hyperpolarized 13C spectra for one case from each of the histologically defined groups. The 3D MRSI shows substantially elevated lactate in the high-grade primary tumor compared with the low-grade tumor. Ala, alanine; Lac, lactate; Pyr, pyruvate (see [22]).

