
FIGURE 4.
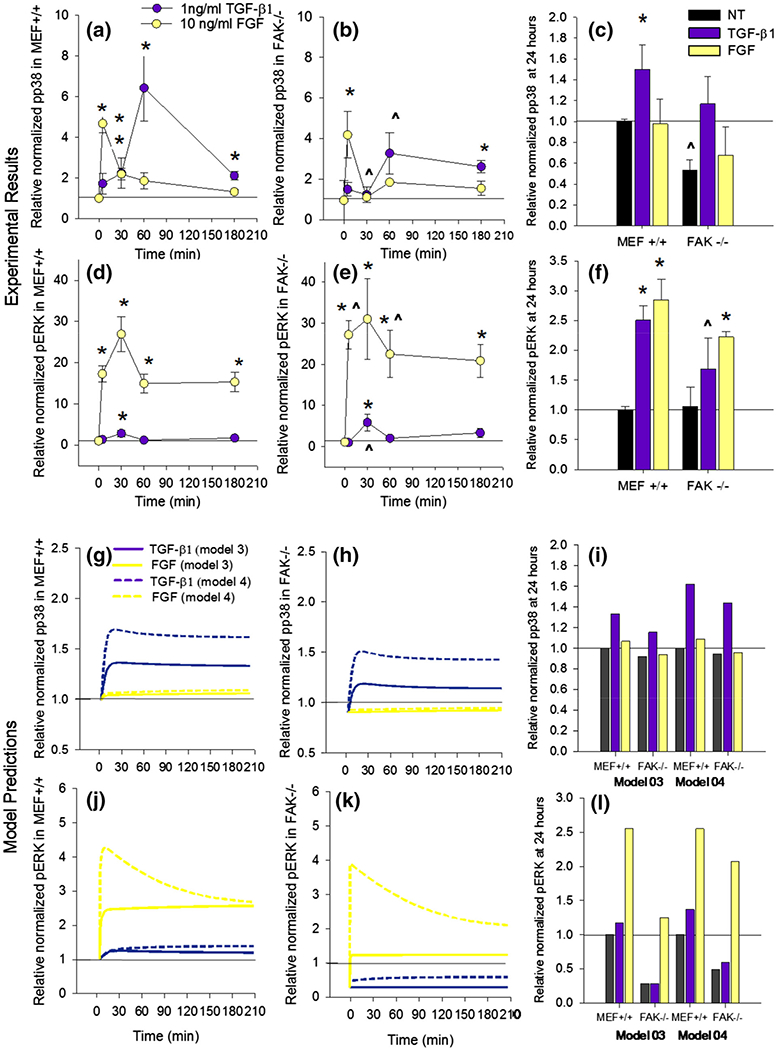
Different dynamic activation profiles for activation of ERK and p38. Averaged results of western blot densitometry analysis for pp38 (a–c) and ERK (d–f) activation over a 3 h time course in MEF+/+ (a, d) and FAK−/− (b, e) cells treated with 1 ng/mL TGF-β1 or 10 ng/mL FGF. Average p38 and ERK activity after 24 h of treatment (c, f). * indicates significant difference (p < 0.05) from average no treatment within cell type and time course. ^ indicates significant difference (p < 0.05) from the MEF+/+ sample within treatment and time point. Relative p38 and pERK activation predicted by models 03 and 04 at corresponding time points (g–l).