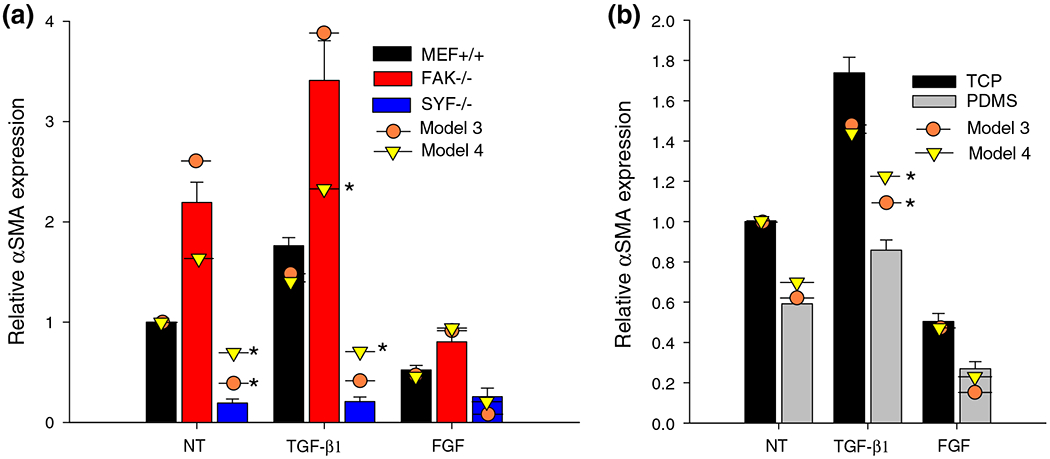
FIGURE 5.

Model fit to TGF-β1 and FGF treatment across cell types and substrates. Average values of αSMA in MEF+/+ and FAK−/− cells (a) after 24 h treatments and (b) in MEFs on TCP or fibronectin coated PDMS. Model predictions from model 03 and model 04 with optimized parameters are plotted as circles and triangles, respectively. Model predictions which are more than one standard deviation away from experimental values are marked by *.
