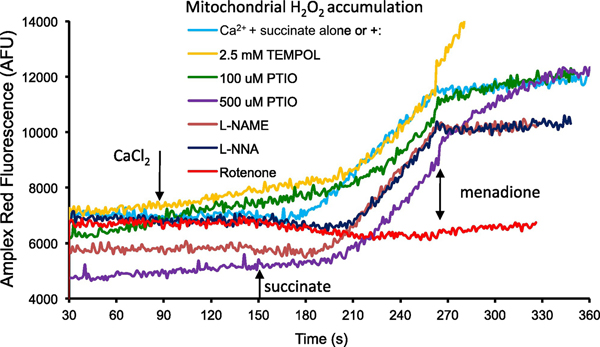
Fig. 2.
Time-dependent changes in amplex red fluorescence (excitation λ530 nm; emission λ583 nm) as an indicator of H2O2 production. Mitochondria were suspended in buffer D containing Amplex red (12.5 μM) and horseradish peroxidase (0.1 U/mL) in the presence of CaCl2 (75 μM added at 90 s with 40 μM EGTA), Na-succinate (10 mM added at 140 s), and menadione (10 μM added at 270 s). L-NAME and L-NNA (10 mM), TEMPOL (2.5 mM), PTIO (100 μM and 500 μM), and the complex I blocker rotenone (10 μM) were also added to buffer D before the addition of mitochondria. Tracings shown were similar in mitochondria isolated from two other guinea pig hearts.

