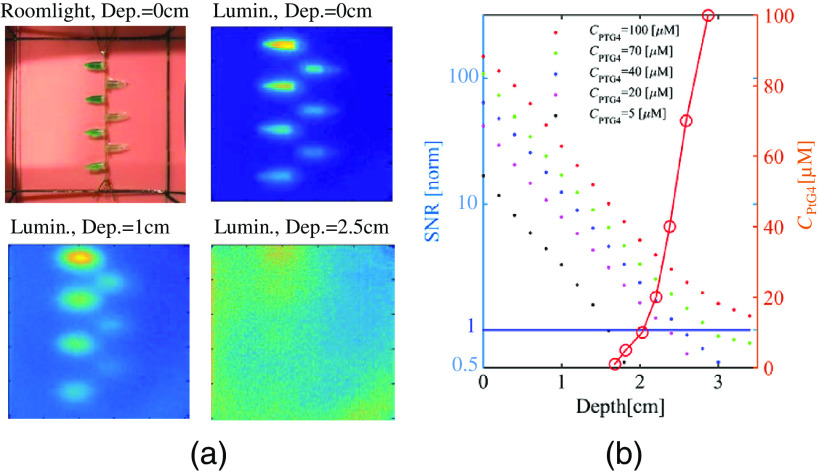
Fig. 2.
Experimental results to investigate image quality versus depth for different concentrations of PtG4 () as shown in the legend, showing (a) the room light image and luminescence images of the phantom used at three different depths in the phantom, and (b) the corresponding SNR values extracted from these images are shown as a function of depth by colored dots. In the same graph, the red line shows the at which (values on left -axis).

