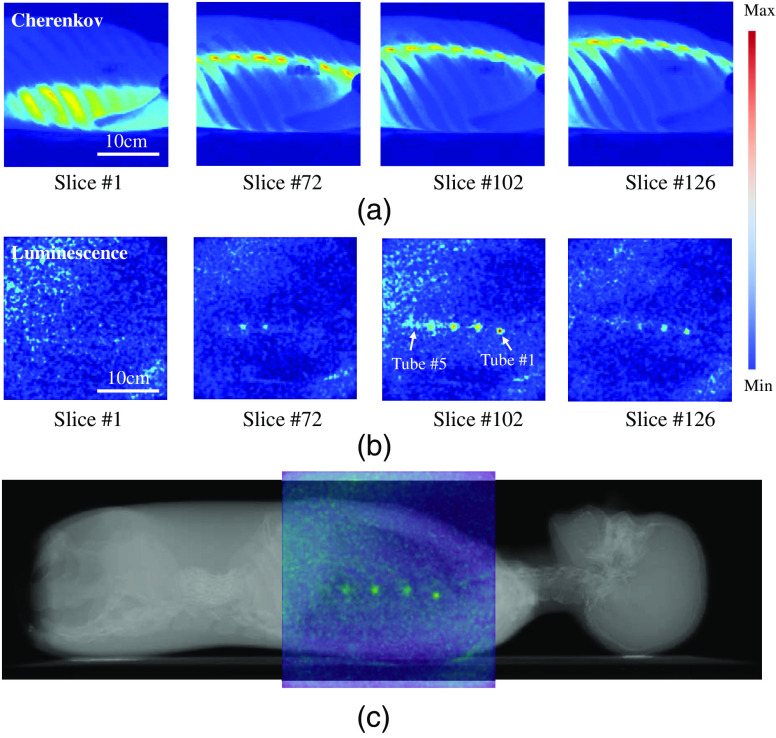
Fig. 3.
Raw measurement sequences are shown for (a) Cherenkov emission and (b) luminescence photons, for the sheet at four different slice locations. In (c) a composition image is shown of the phantom CT with color overlay of the CELSI MIP image. A temporal sweep of the signals in (a) and (b) can be seen in the associated video files as the sheet moved across the phantom body.

