
Fig. 3.
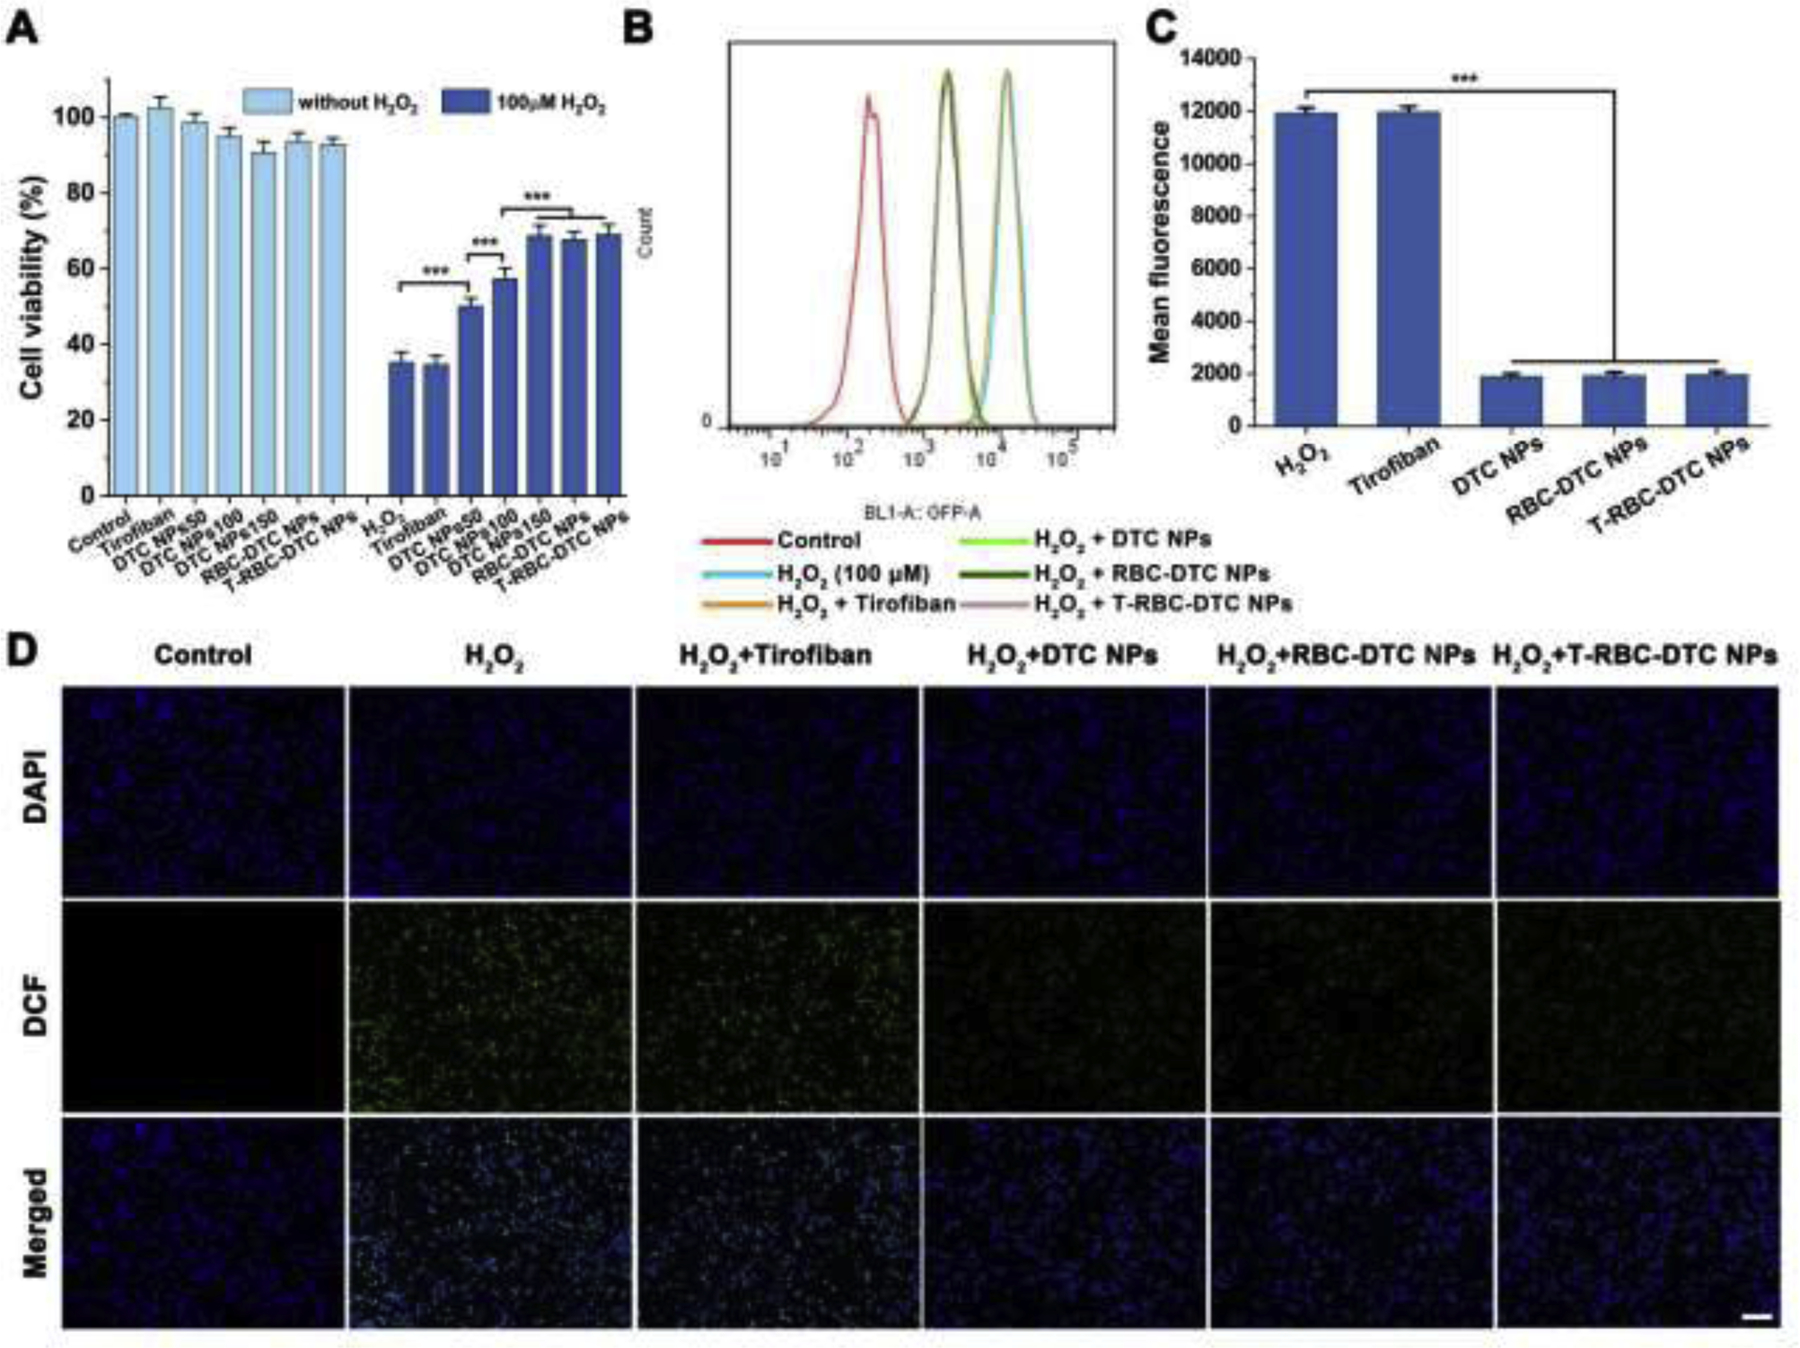
Anti-oxidative effects of the T-RBC-DTC NPs in H2O2-stimulated RAW 264.7 cells. (A) Cytotoxicity and protective effects of different treatments on H2O2-induced RAW 264.7 cells. 50,100, and 150 μg/mL is the concentration of dextran-drug conjugate in the DTC NPs. In the RBC-DTC NPs and T-RBC-DTC NPs groups, the cells were treated with the nanoparticles with the dextran-tirofiban conjugate (DTC) concentration of 150 μg/mL. In the tirofiban group, the cells were treated with 78 μg/mL of tirofiban, an equivalent amount of drug in 150 μg/mL of DTC. Data is shown as mean ± SD (n=6). (B) Flow cytometry histogram of intracellular ROS level in H2O2-stimulated RAW 264.7 cells subjected to different treatments. (C) Quantitative analysis of the intracellular ROS level in RAW 264.7 cells. Data is shown as mean ± SD (n=3). (D) Fluorescence microscopy images of intracellular ROS in RAW 264.7 cells subjected to different treatments. Blue channel: 4’,6-diamidino-2-phenylindole (DAPI) stained nucleus. Green channel: dihydrodichlorofluorescein (DCF) fluorescence illustrated intracellular ROS. Scale bar: 100 μm. ***p < 0.001.