
Fig. 4.
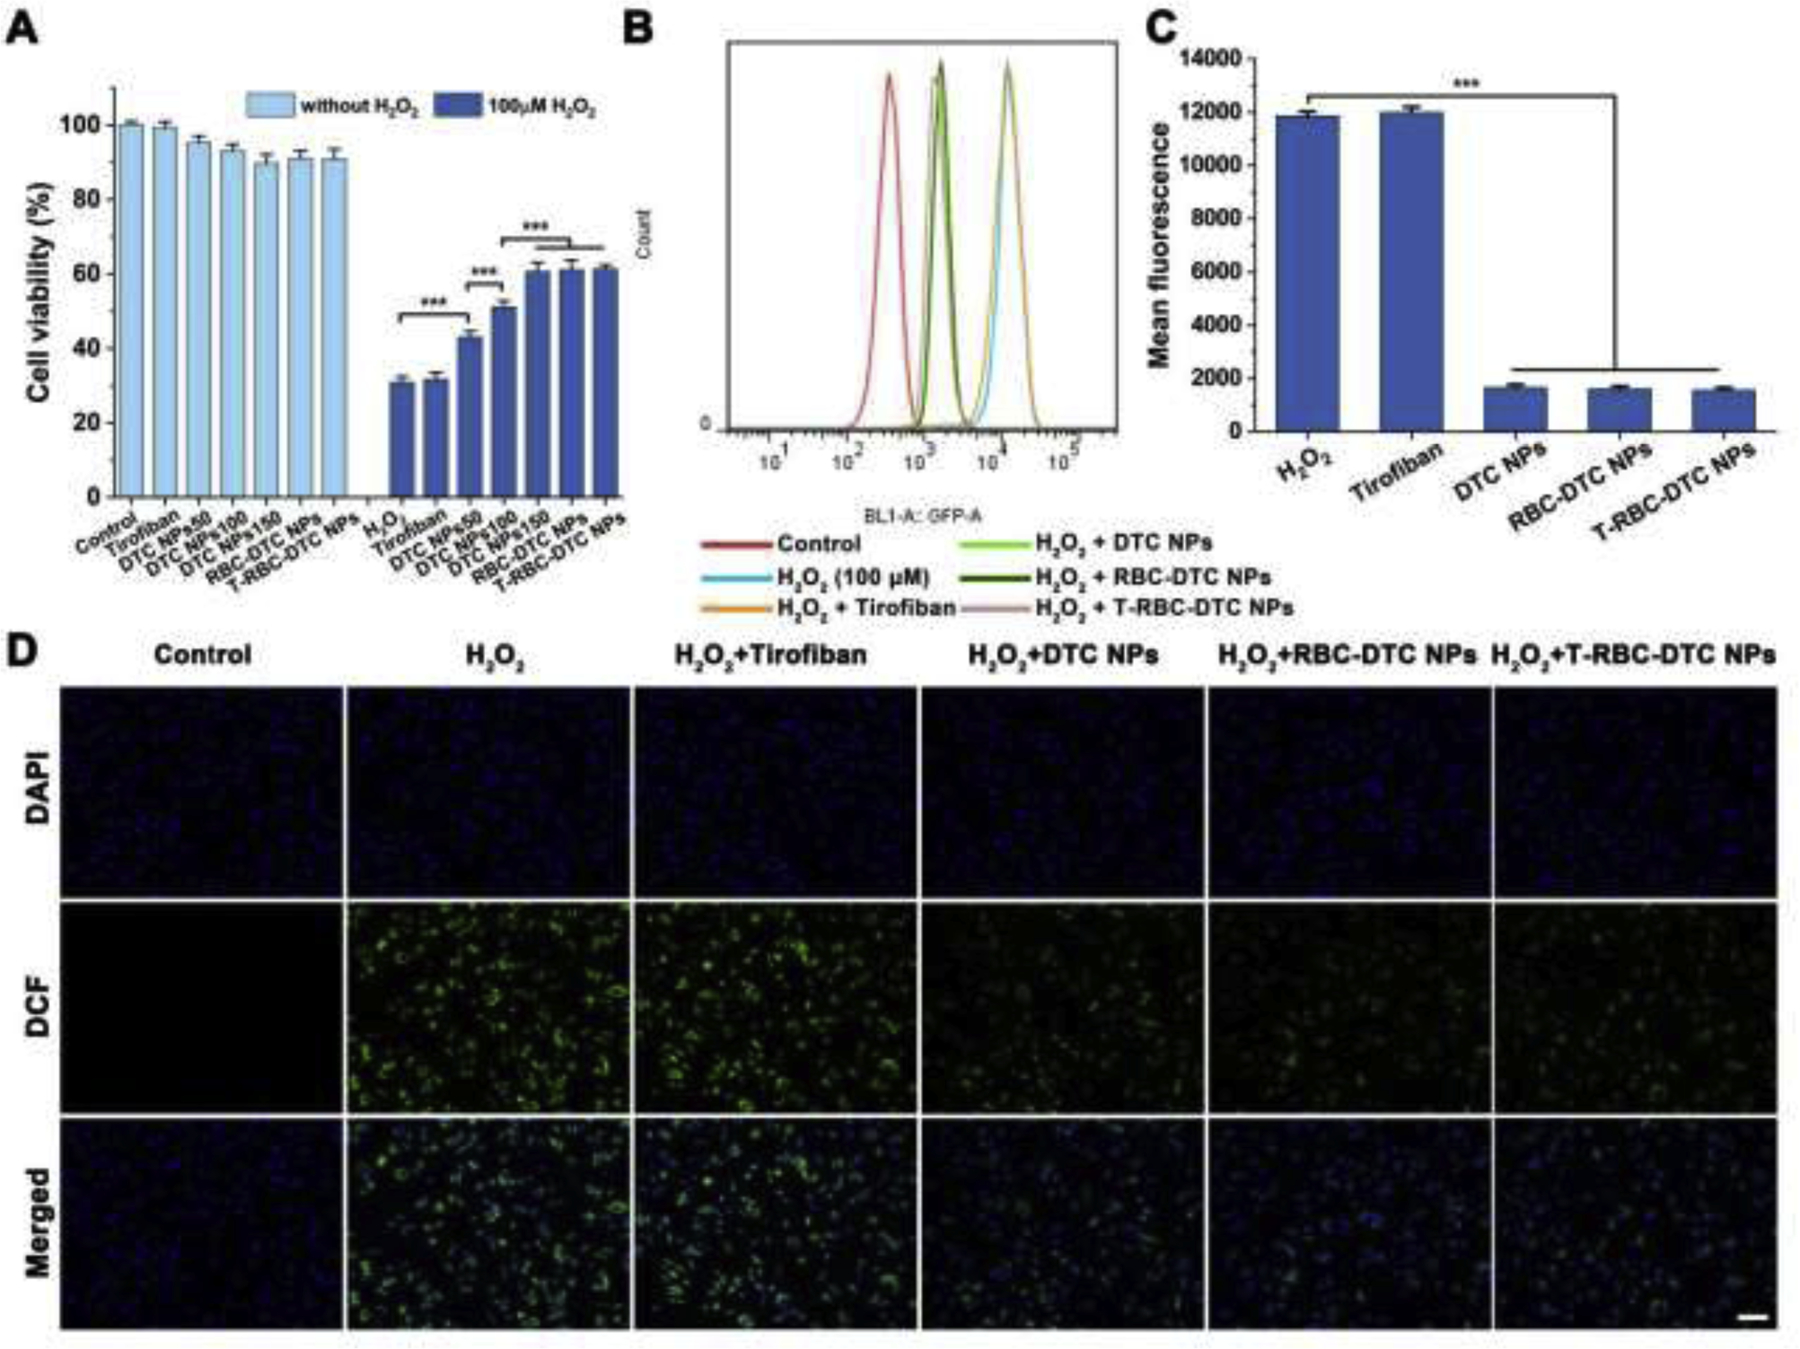
Anti-oxidative effects of the T-RBC-DTC NPs in H2O2-stimulated vascular endothelial cells. (A) Cytotoxicity and protective effects of different formulations on H2O2-induced vascular endothelial cells. Data is shown as mean ± SD (n=6). (B) Flow cytometry analysis of intracellular ROS in H2O2-stimulated HUVECs subjected to different treatments. (C) Quantitative analysis of the intracellular ROS level in HUVECs. Data is shown as mean ± SD (n=3). (D) Detection of intracellular ROS using an ROS indicator in HUVECs subjected to different treatments via fluorescence imaging. Blue channel: 4’,6-diamidino-2-phenylindole (DAPI) stained nucleus. Green channel: dihydrodichlorofluorescein (DCF) fluorescence illustrated intracellular ROS. Scale bar: 100 μm. ***p < 0.001.