
Fig. 5.
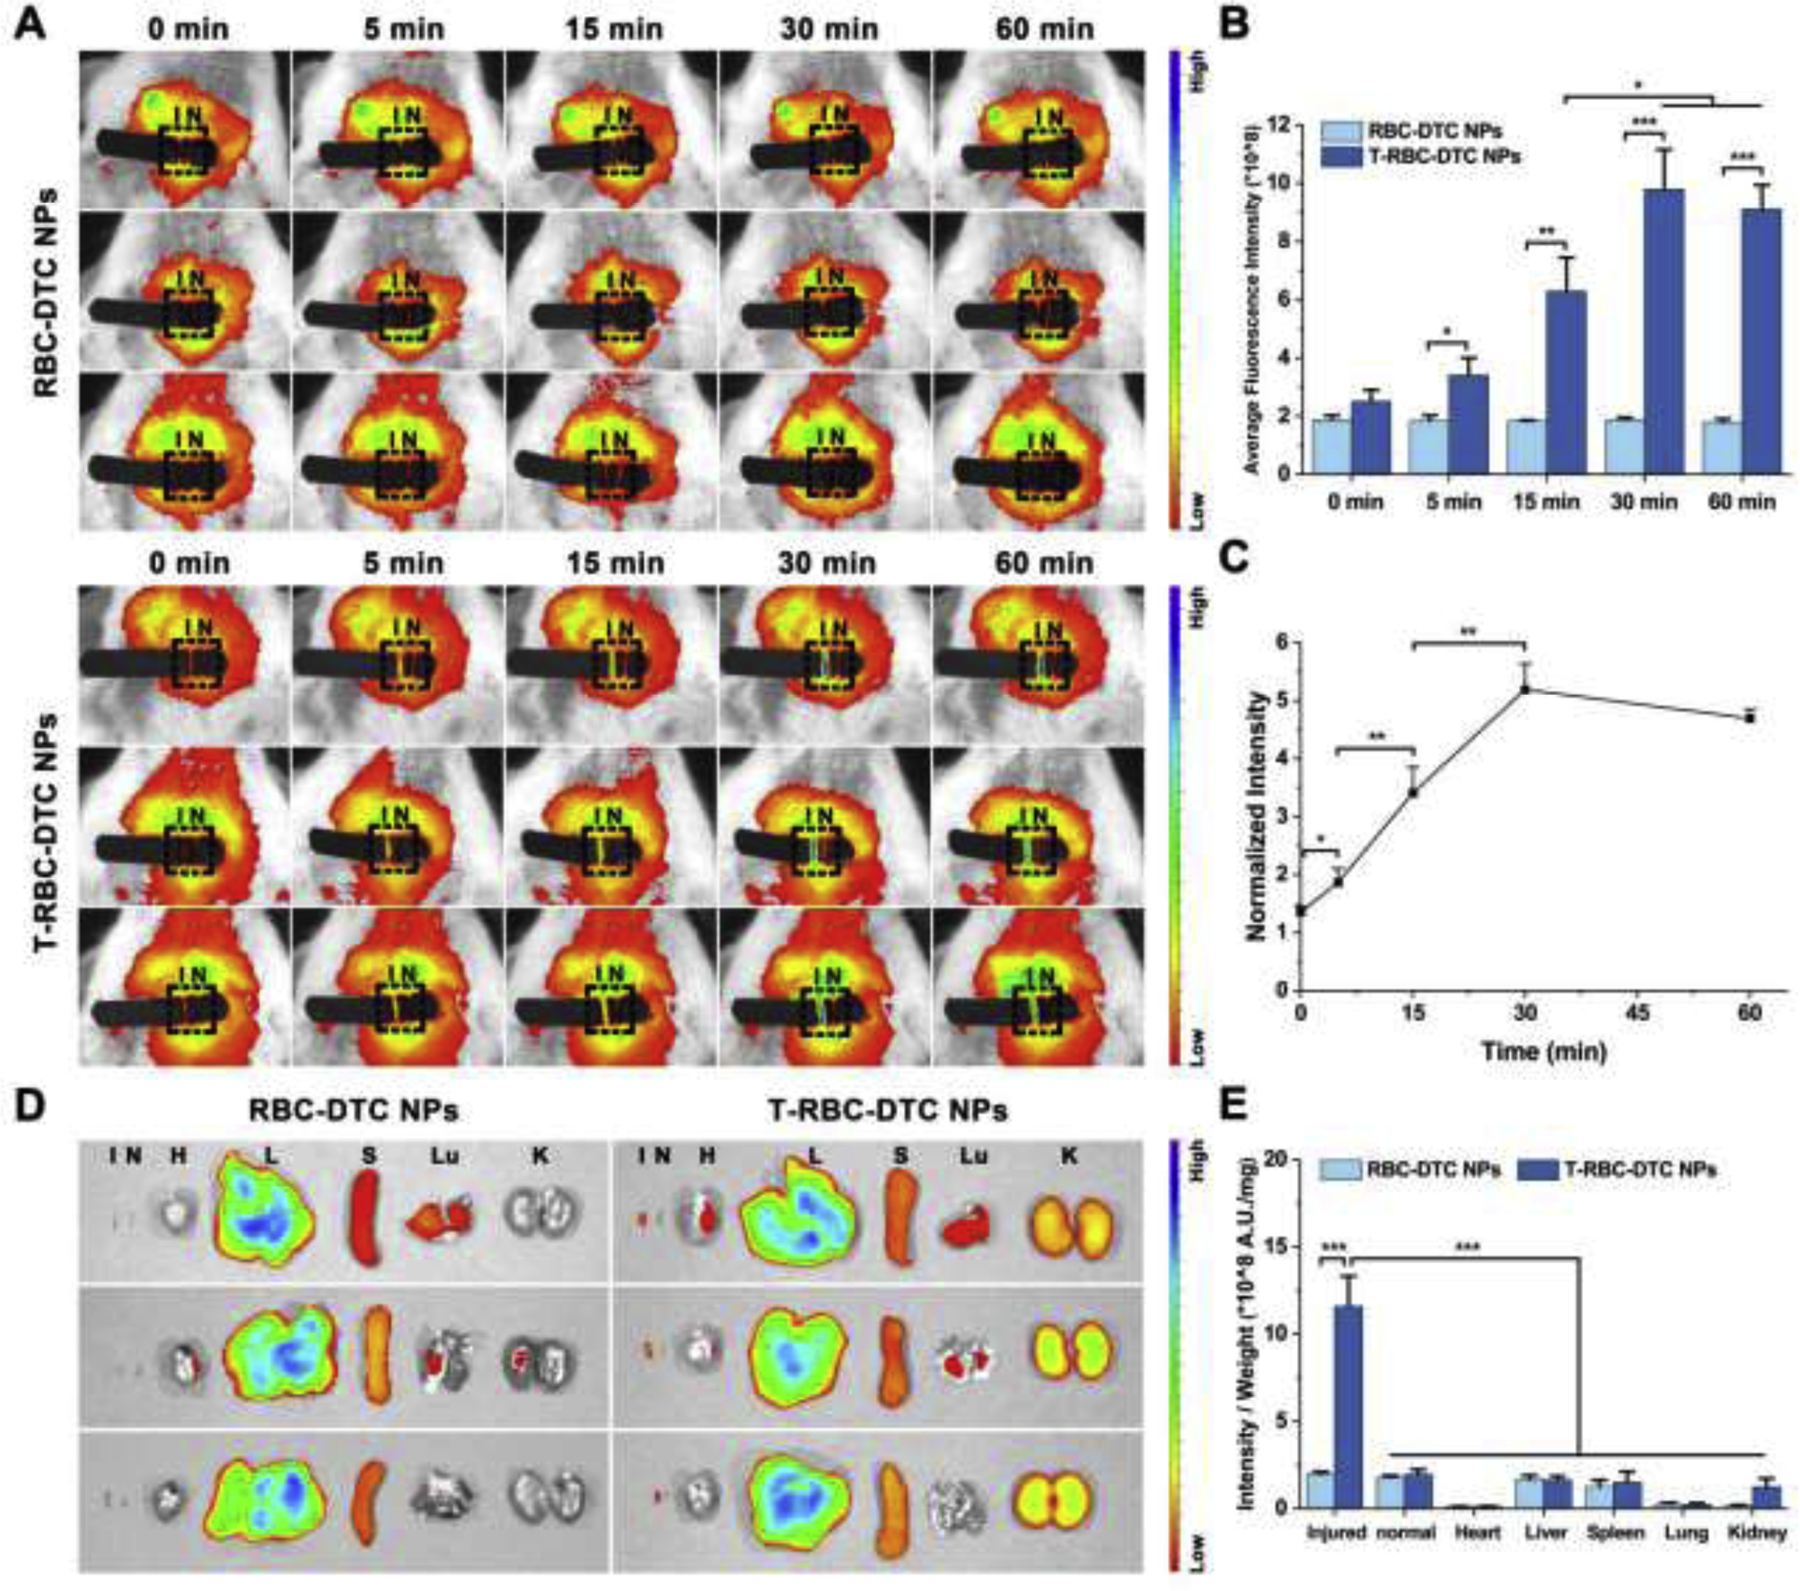
Targeting ability of the T-RBC-DTC NPs to the thrombosed vessels. (A) In vivo fluorescence images of the carotid arteries treated with the Cy 5.5-labeled RBC-DTC NPs and T-RBC-DTC NPs, respectively. I and N represent the injured and non-injured artery (outlined by the black rectangle), respectively. (B) Quantification of fluorescence intensity of carotid arteries in (A). Data is shown as mean ± SD (n=3). (C) The ratio of normalized fluorescence intensity between the FeCl3-treated artery and non-injured artery as a function of time in the T-RBC-DTC NPs group. Data is shown as mean ± SD (n=3). (D) Ex vivo fluorescence image of the Cy 5.5-labeled RBC-DTC NPs and T-RBC-DTC NPs in the major organs, and injured and non-injured carotid artery. H, L, S, Lu, K, I and N represent heart, liver, spleen, lung, kidney, injured artery, and non-injured artery, respectively. (E) Quantitative analysis of the mean fluorescence intensity per unit mass in each organ or tissue shown in the ex vivo images. Data is shown as mean ± SD (n=3). *p < 0.05, **p < 0.01, ***p < 0.001.